INVITE-ONLY SCRIPT
已更新 EP Trend Heatmap MTF
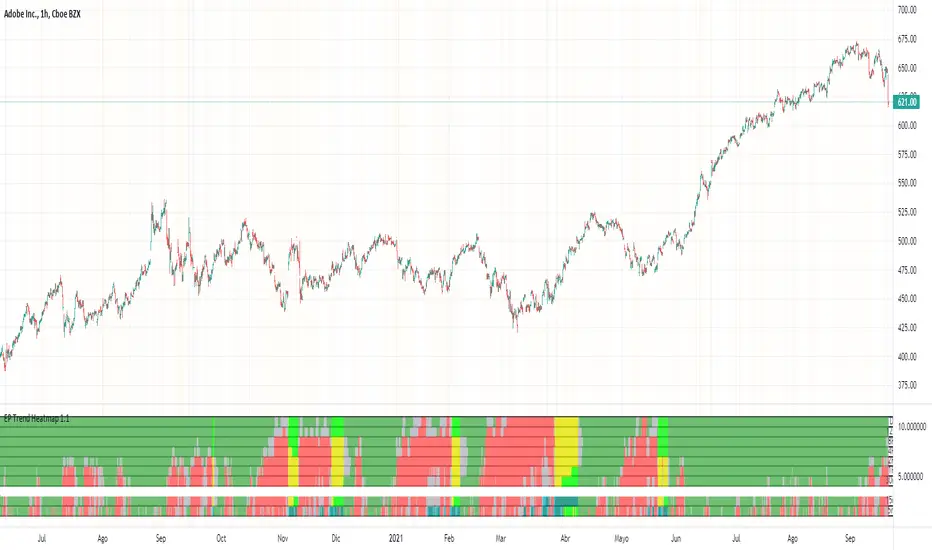
EP Trend Heatmap MTF is an indicator that reflects the dominant trend in a total of 9 timeframes.
These timeframes are configurable.
By default, two fast timeframes (5 and 15 min) and 7 timeframes of higher temporalities are shown (30m, 1H, 2H, 4H, 8H, 12H and 1D).
The first two timeframes can be used to fit inputs into very small time frames.
The colors indicate:
green: buying trend
red: selling trend
gray: neutral or undefined trend
aqua: converging long averages (emaLTC rising below emaLTD)
teal: converging long averages and buying trend
The indicator is very effective in detecting the recovery of the price after a fall. In these cases, it will show bluish colors (aqua and teal) in the lower timeframes, while the red colors give way to neutral and green colors in the higher ones, in a staggered way.
During a strong uptrend, we will see all the timeframes in green, except in the breaks that the price makes, where we will wait for the red colors in lower timeframes to give way to the neutral color and the subsequent green.
When the top 7 timeframes turn green ("green wall" pattern) it will be a good time to buy.
The indicator uses a total of 10 configurable averages.
It is based on the same averages as the EP Prism indicator, so we recommend using them together, which will improve the accuracy of the latter's input signals.
版本注释
What's new:- The "Clear Sky" pattern is now displayed.
This pattern shows the situation of convergent averages in lower TimeFrames and the absence of sales trends in higher timeframes, preceding a possible rise in price. It will show yellow color on neutral TFs, and more intense green on uptrend TFs.
- An option has been added in the configuration to relax the criteria for the appearance of the pattern. The pattern will be displayed even if there are selling trends above the specified timeframe.
"Allow reds above TF # (a number from 5 to 9)"
9 = not relax.
The default value is 8. Lower values may cause errors in the evaluation of the actual situation.
仅限邀请脚本
只有作者授权的用户才能访问此脚本。您需要申请并获得使用许可。通常情况下,付款后即可获得许可。更多详情,请按照下方作者的说明操作,或直接联系EP-Trading。
请注意,此私密、仅限邀请脚本未经脚本版主审核,是否符合网站规则尚未确定。 TradingView不建议您付费购买或使用任何脚本,除非您完全信任其作者并了解其工作原理。您也可以在我们的社区脚本找到免费的开源替代方案。
作者的说明
To access a free trial, send a private message or fill out the request form at ep-trading.com
免责声明
这些信息和出版物并非旨在提供,也不构成TradingView提供或认可的任何形式的财务、投资、交易或其他类型的建议或推荐。请阅读使用条款了解更多信息。