OPEN-SOURCE SCRIPT
Profitability Power Ratio
Profitability Power Ratio
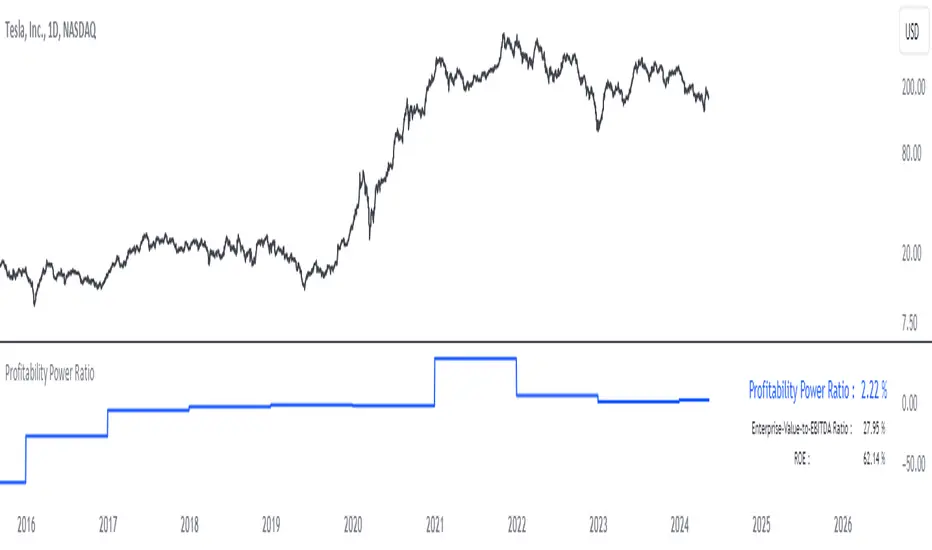
The Profitability Power Ratio is a financial metric designed to assess the efficiency of a company's operations by evaluating the relationship between its Enterprise Value (EV) and Return on Equity (ROE). This ratio provides insights into how effectively a company generates profits relative to its equity and overall valuation.
Qualities and Interpretations:
1. Efficiency Benchmark: The Profitability Power Ratio serves as a benchmark for evaluating how efficiently a company utilizes its equity capital to generate profits. A higher ratio indicates that the company is generating significant profits relative to its valuation, reflecting efficient use of invested capital.
2. Financial Health Indicator: This ratio can be used as an indicator of financial health. A consistently high or improving ratio over time suggests strong operational efficiency and sustainable profitability.
3. Investment Considerations: Investors can use this ratio to assess the attractiveness of an investment opportunity. A high ratio may signal potential for good returns, but it's important to consider the underlying reasons for the ratio's level to avoid misinterpretation.
4. Risk Evaluation: An excessively high Profitability Power Ratio could also signal elevated risk. It may indicate aggressive financial leveraging or unsustainable growth expectations, which could pose risks during economic downturns or market fluctuations.
Interpreting the Ratio:
1. Higher Ratio: A higher Profitability Power Ratio typically signifies efficient capital utilization and strong profitability relative to the company's valuation.
2. Lower Ratio: A lower ratio may suggest inefficiencies in capital allocation or lower profitability relative to enterprise value.
3. Benchmarking: Compare the company's ratio with industry peers and historical performance to gain deeper insights into its financial standing and operational efficiency.
Using the Indicator:
The Profitability Power Ratio is plotted on a chart to visualize trends and fluctuations over time. Users can customize the color of the plot to emphasize this metric and integrate it into their financial analysis toolkit for comprehensive decision-making.
Disclaimer: The Profitability Power Ratio is a financial metric designed for informational purposes only and should not be considered as financial or investment advice. Users should conduct thorough research and analysis before making any investment decisions based on this indicator. Past performance is not indicative of future results. All investments involve risks, and users are encouraged to consult with a qualified financial advisor or professional before making investment decisions.
开源脚本
秉承TradingView的精神,该脚本的作者将其开源,以便交易者可以查看和验证其功能。向作者致敬!您可以免费使用该脚本,但请记住,重新发布代码须遵守我们的网站规则。
Plan the trade ⚡ Trade the plan
免责声明
这些信息和出版物并非旨在提供,也不构成TradingView提供或认可的任何形式的财务、投资、交易或其他类型的建议或推荐。请阅读使用条款了解更多信息。
开源脚本
秉承TradingView的精神,该脚本的作者将其开源,以便交易者可以查看和验证其功能。向作者致敬!您可以免费使用该脚本,但请记住,重新发布代码须遵守我们的网站规则。
Plan the trade ⚡ Trade the plan
免责声明
这些信息和出版物并非旨在提供,也不构成TradingView提供或认可的任何形式的财务、投资、交易或其他类型的建议或推荐。请阅读使用条款了解更多信息。