OPEN-SOURCE SCRIPT
已更新 Multi-Timeframe Stoch RSI Dashboard
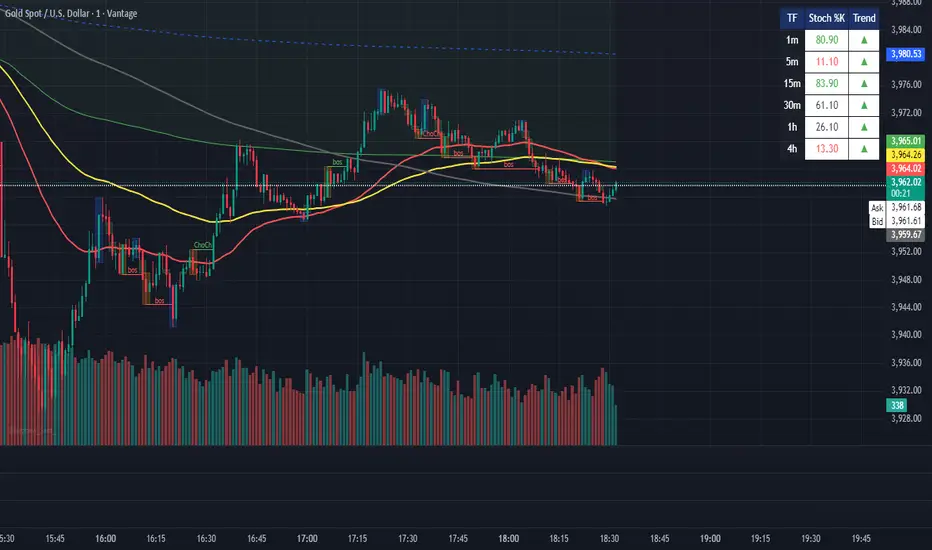
Shows the Stoch RSI values for different timeframes in a box on the top right corner.
1m
5m
15m
30m
1h
4h
Above 80 = green
Below 20 = red
Black = between 20 and 80.
1m
5m
15m
30m
1h
4h
Above 80 = green
Below 20 = red
Black = between 20 and 80.
版本注释
Version 2 where values are correct when switching timeframes.版本注释
Added trend arrows to show the direction of the trend of the Stoch RSI.开源脚本
本着TradingView的真正精神,此脚本的创建者将其开源,以便交易者可以查看和验证其功能。向作者致敬!虽然您可以免费使用它,但请记住,重新发布代码必须遵守我们的网站规则。
免责声明
这些信息和出版物并不意味着也不构成TradingView提供或认可的金融、投资、交易或其它类型的建议或背书。请在使用条款阅读更多信息。
开源脚本
本着TradingView的真正精神,此脚本的创建者将其开源,以便交易者可以查看和验证其功能。向作者致敬!虽然您可以免费使用它,但请记住,重新发布代码必须遵守我们的网站规则。
免责声明
这些信息和出版物并不意味着也不构成TradingView提供或认可的金融、投资、交易或其它类型的建议或背书。请在使用条款阅读更多信息。