OPEN-SOURCE SCRIPT
G-RSI&EMA channel v.1
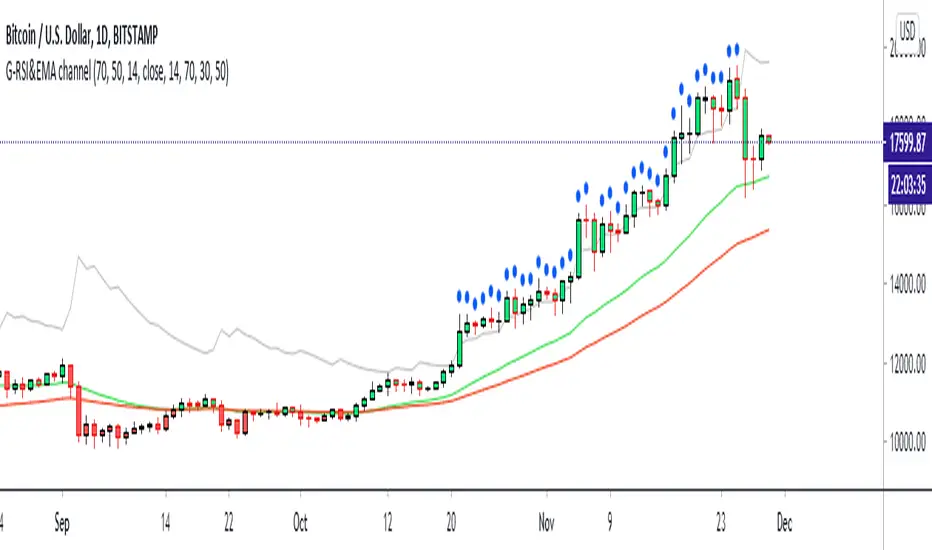
This my 2nd indicator : It's just a Strenghtening of trend channal
If price can come up on the green line it's mean price is side way or maybe bullish
and if price can come up on RSI (14)50 and EMA50 it have problaby to bullish trend
If the price have blue ball it's mean crazy strong bullish trend
If the price have red ball it's mean crazy strong bearish trend
you can use my 1st script together : 1st is " G-Bollingerbands Volatility breakout "
My 1st script detect the price begin to have volatility
My 2nd scrit detect the trend
Goodluck :D
PS: My 2nd script develop from someone in tradingview RSI script i'm sorry I can't remember but thank you very much.
开源脚本
秉承TradingView的精神,该脚本的作者将其开源,以便交易者可以查看和验证其功能。向作者致敬!您可以免费使用该脚本,但请记住,重新发布代码须遵守我们的网站规则。
免责声明
这些信息和出版物并非旨在提供,也不构成TradingView提供或认可的任何形式的财务、投资、交易或其他类型的建议或推荐。请阅读使用条款了解更多信息。
免责声明
这些信息和出版物并非旨在提供,也不构成TradingView提供或认可的任何形式的财务、投资、交易或其他类型的建议或推荐。请阅读使用条款了解更多信息。