OPEN-SOURCE SCRIPT
Fibonacci Ratios with Volatility(Weekly Time Frame.)
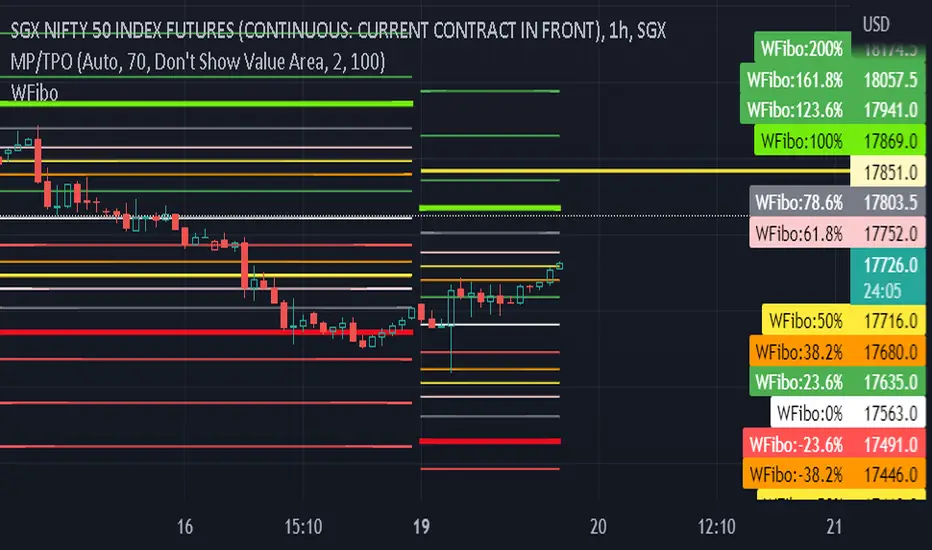
Script is based on weekly time Frame. Fib ratios are drawn at the Open of the Market. Open price is compared with Previous week High , low and close. If weekly open is above Previous week high or low, Fib 0 % is plotted above High or the low as the case may be . If weekly open is between previous week high and low Fib 0% is equal to previous week Close and other fib ratios are plotted accordingly. As its vol based, works fantastically. This script is inspired by Fibonacci and Volatility script by PB GHOSH.
开源脚本
秉承TradingView的精神,该脚本的作者将其开源,以便交易者可以查看和验证其功能。向作者致敬!您可以免费使用该脚本,但请记住,重新发布代码须遵守我们的网站规则。
免责声明
这些信息和出版物并非旨在提供,也不构成TradingView提供或认可的任何形式的财务、投资、交易或其他类型的建议或推荐。请阅读使用条款了解更多信息。
开源脚本
秉承TradingView的精神,该脚本的作者将其开源,以便交易者可以查看和验证其功能。向作者致敬!您可以免费使用该脚本,但请记住,重新发布代码须遵守我们的网站规则。
免责声明
这些信息和出版物并非旨在提供,也不构成TradingView提供或认可的任何形式的财务、投资、交易或其他类型的建议或推荐。请阅读使用条款了解更多信息。