PROTECTED SOURCE SCRIPT
已更新 RSI Orderflow S/R Lines
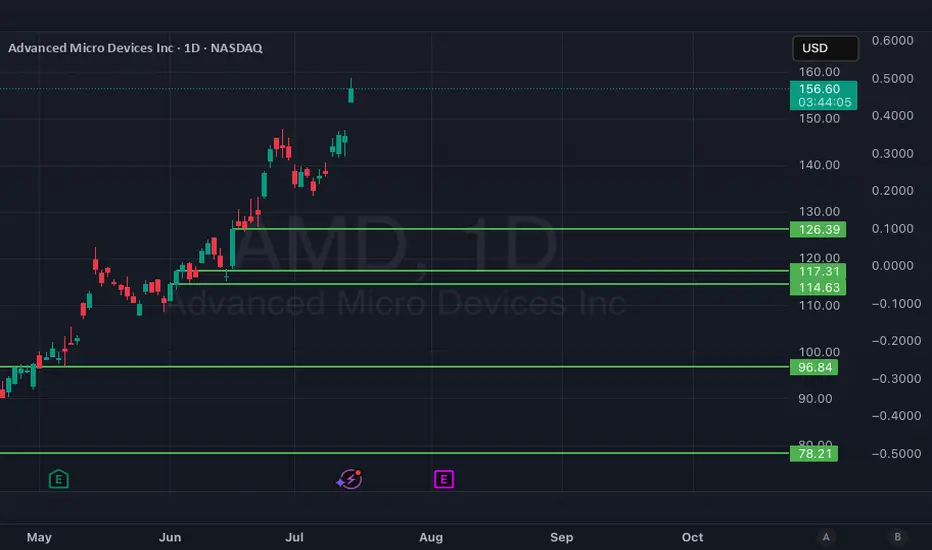
RSI Orderflow S/R Lines is a lightweight, overlay-style indicator that automatically marks short-term support and resistance levels derived from momentum shifts in the 14-period Relative Strength Index. Instead of relying on raw RSI values, the script tracks the change in RSI from one bar to the next (ΔRSI). When this one-bar delta exceeds a user-defined positive threshold, it treats the surge in buying momentum as a potential support zone and drops a horizontal line at that bar’s close. Conversely, when ΔRSI falls below the negative of the threshold, the script interprets the selling pressure as a resistance cue and plots a line at that close.
Two simple inputs keep the tool highly configurable. “RSI Δ Threshold” (0–20) lets you dial in how sensitive the signal is: lower values will print levels more frequently, while higher settings focus only on the most forceful momentum swings. “Max S/R Lines” (1–10) controls chart clutter by limiting how many active levels remain on the screen. As new signals emerge, the indicator adds fresh lines and automatically deletes the oldest ones once the user-set cap is reached.
Each level is dynamic in color: green whenever the current price trades above the line (acting as support) and red whenever price is below (acting as resistance). Because every line extends to the right indefinitely, the indicator gives you a clear, real-time view of recent momentum-based zones that may attract bids or offers on subsequent retests.
This approach can complement traditional technical analysis by highlighting hidden supply-and-demand pockets rooted in aggressive shifts in trader conviction. Combine it with price-action confirmation, volume patterns, or broader market structure to refine entries, exits, and stop placement. As always, test settings on your preferred markets and timeframes before committing real capital, and remember that no indicator guarantees future performance—sound risk management is essential.
版本注释
**RSI Orderflow S/R Lines** is a lightweight, overlay-style indicator that automatically marks short-term support and resistance levels derived from momentum shifts in the 14-period Relative Strength Index. Instead of relying on raw RSI values, the script tracks the *change* in RSI from one bar to the next (ΔRSI). When this one-bar delta exceeds a user-defined positive threshold, it treats the surge in buying momentum as a potential support zone and drops a horizontal line at that bar’s close. Conversely, when ΔRSI falls below the negative of the threshold, the script interprets the selling pressure as a resistance cue and plots a line at that close.Two simple inputs keep the tool highly configurable. **“RSI Δ Threshold”** (0–20) lets you dial in how sensitive the signal is: lower values will print levels more frequently, while higher settings focus only on the most forceful momentum swings. **“Max S/R Lines”** (1–10) controls chart clutter by limiting how many active levels remain on the screen. As new signals emerge, the indicator adds fresh lines and automatically deletes the oldest ones once the user-set cap is reached.
Each level is dynamic in color: green whenever the current price trades above the line (acting as support) and red whenever price is below (acting as resistance). Because every line extends to the right indefinitely, the indicator gives you a clear, real-time view of recent momentum-based zones that may attract bids or offers on subsequent retests.
This approach can complement traditional technical analysis by highlighting hidden supply-and-demand pockets rooted in aggressive shifts in trader conviction. Combine it with price-action confirmation, volume patterns, or broader market structure to refine entries, exits, and stop placement. As always, test settings on your preferred markets and timeframes before committing real capital, and remember that no indicator guarantees future performance—sound risk management is essential.
版本注释
RSI Orderflow S/R Lines is a lightweight, overlay-style indicator that automatically marks short-term support and resistance levels derived from momentum shifts in the 14-period Relative Strength Index. Instead of relying on raw RSI values, the script tracks the change in RSI from one bar to the next (ΔRSI). When this one-bar delta exceeds a user-defined positive threshold, it treats the surge in buying momentum as a potential support zone and drops a horizontal line at that bar’s close. Conversely, when ΔRSI falls below the negative of the threshold, the script interprets the selling pressure as a resistance cue and plots a line at that close.Two simple inputs keep the tool highly configurable. “RSI Δ Threshold” (0–25) lets you dial in how sensitive the signal is: lower values will print levels more frequently, while higher settings focus only on the most forceful momentum swings. “Max S/R Lines” (1–10) controls chart clutter by limiting how many active levels remain on the screen. As new signals emerge, the indicator adds fresh lines and automatically deletes the oldest ones once the user-set cap is reached.
Each level is dynamic in color: green whenever the current price trades above the line (acting as support) and red whenever price is below (acting as resistance). Because every line extends to the right indefinitely, the indicator gives you a clear, real-time view of recent momentum-based zones that may attract bids or offers on subsequent retests.
This approach can complement traditional technical analysis by highlighting hidden supply-and-demand pockets rooted in aggressive shifts in trader conviction. Combine it with price-action confirmation, volume patterns, or broader market structure to refine entries, exits, and stop placement. As always, test settings on your preferred markets and timeframes before committing real capital, and remember that no indicator guarantees future performance—sound risk management is essential.
版本注释
**RSI Orderflow S/R Lines** is a lightweight, overlay-style indicator that automatically marks short-term support and resistance levels derived from momentum shifts in the 14-period Relative Strength Index. Instead of relying on raw RSI values, the script tracks the *change* in RSI from one bar to the next (ΔRSI). When this one-bar delta exceeds a user-defined positive threshold, it treats the surge in buying momentum as a potential support zone and drops a horizontal line at that bar’s close. Conversely, when ΔRSI falls below the negative of the threshold, the script interprets the selling pressure as a resistance cue and plots a line at that close.Two simple inputs keep the tool highly configurable. **“RSI Δ Threshold”** (0–20) lets you dial in how sensitive the signal is: lower values will print levels more frequently, while higher settings focus only on the most forceful momentum swings. **“Max S/R Lines”** (1–10) controls chart clutter by limiting how many active levels remain on the screen. As new signals emerge, the indicator adds fresh lines and automatically deletes the oldest ones once the user-set cap is reached.
Each level is dynamic in color: green whenever the current price trades above the line (acting as support) and red whenever price is below (acting as resistance). Because every line extends to the right indefinitely, the indicator gives you a clear, real-time view of recent momentum-based zones that may attract bids or offers on subsequent retests.
This approach can complement traditional technical analysis by highlighting hidden supply-and-demand pockets rooted in aggressive shifts in trader conviction. Combine it with price-action confirmation, volume patterns, or broader market structure to refine entries, exits, and stop placement. As always, test settings on your preferred markets and timeframes before committing real capital, and remember that no indicator guarantees future performance—sound risk management is essential.
版本注释
Edit to indicator name.版本注释
changed max threshold to 20版本注释
Cleaned up line drawing logic.版本注释
Updated logic to include dynamic price labels.版本注释
Added alerts.版本注释
Updated chart and indicator name.受保护脚本
此脚本以闭源形式发布。 但是,您可以自由使用,没有任何限制 — 了解更多信息这里。
免责声明
这些信息和出版物并非旨在提供,也不构成TradingView提供或认可的任何形式的财务、投资、交易或其他类型的建议或推荐。请阅读使用条款了解更多信息。
受保护脚本
此脚本以闭源形式发布。 但是,您可以自由使用,没有任何限制 — 了解更多信息这里。
免责声明
这些信息和出版物并非旨在提供,也不构成TradingView提供或认可的任何形式的财务、投资、交易或其他类型的建议或推荐。请阅读使用条款了解更多信息。