INVITE-ONLY SCRIPT
Cloud Version 2.0
已更新
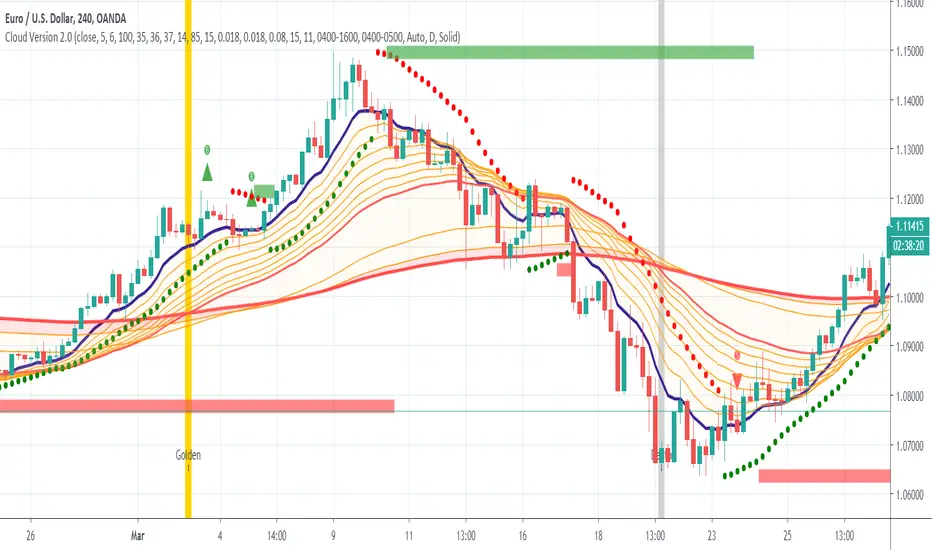
This is a revised version of the "Cloud" indicator. Some of the changes are as follow:
Updated EMA values:
Multi Exponential Moving Average ( EMA ) plotted.
Exponential Moving Average ( EMA ) - 10, 15, 20, 25, 30, 35, 40, 45, 50, 100, and 200 (Default Values)
Updated RSI Overbought/Oversold default values:
Built-in RSI plotted above or below candlestick .
Relative Strength Index ( RSI ) - Length 14, Overbought 85, & Oversold 15 (Defualt Values)
Built in auto tracking number of last candle/s Highest & Lowest with the closing price of the previous candle by placing Blue Lines (highest/lowest) and Previous closed price candle stick with an Orange Line.
Recently added 50 and 200 crossover moving averages:
The death cross signals a possible shift in trend sentiment from bullish to bearish . Golden Cross signals a shift in a bearish trend to a bullish trend .
Death Cross and Golden Cross Alerts
PSAR (Uptrend/Downtrend)
Support & Resistance Zone (Standard)
Buy/Short Alerts and Notifications
版本注释
Corrected "Text" messages in the wrong labels.仅限邀请脚本
仅限作者授权的用户访问此脚本,并且通常需要付费。您可以将其添加到收藏中,但是只有在向作者请求并获得许可之后,才能使用它。 请联系CloudTrader_1了解更多信息,或按照以下作者的说明操作。
TradingView does not suggest paying for a script and using it unless you 100% trust its author and understand how the script works. In many cases, you can find a good open-source alternative for free in our Community Scripts.
想在图表上使用此脚本?
警告:请在申请访问权限之前阅读。
免责声明
这些信息和出版物并不意味着也不构成TradingView提供或认可的金融、投资、交易或其它类型的建议或背书。请在使用条款阅读更多信息。