OPEN-SOURCE SCRIPT
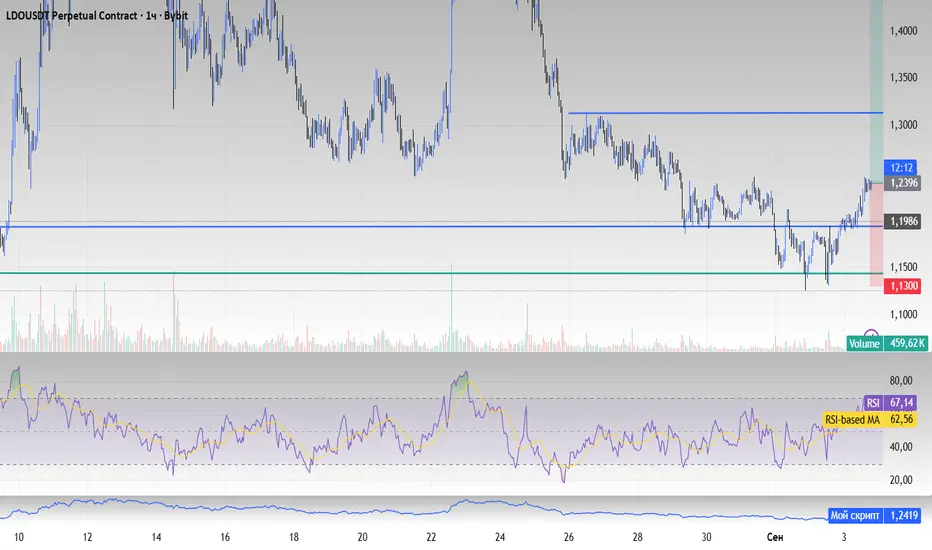
Мой скрипт
//version=5
indicator("Market Structure BOS/CHoCH", overlay=true, max_labels_count=500)
// === Settings ===
swingLen = input.int(3, "Swing Length", minval=1)
showBOS = input.bool(true, "Show BOS")
showCHoCH = input.bool(true, "Show CHoCH")
// === Identify swing highs and lows ===
var float lastHigh = na
var float lastLow = na
swingHigh = ta.pivothigh(high, swingLen, swingLen)
swingLow = ta.pivotlow(low, swingLen, swingLen)
if not na(swingHigh)
lastHigh := swingHigh
if not na(swingLow)
lastLow := swingLow
// === Determine HH, HL, LH, LL ===
hh = not na(swingHigh) and swingHigh > lastHigh
hl = not na(swingLow) and swingLow > lastLow
lh = not na(swingHigh) and swingHigh < lastHigh
ll = not na(swingLow) and swingLow < lastLow
// === Plot labels for structure points ===
if hh
label.new(bar_index, swingHigh, "HH", style=label.style_label_down, color=color.green, textcolor=color.white, yloc=yloc.abovebar)
if hl
label.new(bar_index, swingLow, "HL", style=label.style_label_up, color=color.green, textcolor=color.white, yloc=yloc.belowbar)
if lh
label.new(bar_index, swingHigh, "LH", style=label.style_label_down, color=color.red, textcolor=color.white, yloc=yloc.abovebar)
if ll
label.new(bar_index, swingLow, "LL", style=label.style_label_up, color=color.red, textcolor=color.white, yloc=yloc.belowbar)
// === BOS (Break of Structure) detection ===
bosUp = ta.crossover(close, lastHigh)
bosDown = ta.crossunder(close, lastLow)
if showBOS and bosUp
label.new(bar_index, high, "BOS ↑", style=label.style_label_down, color=color.blue, textcolor=color.white, yloc=yloc.abovebar)
if showBOS and bosDown
label.new(bar_index, low, "BOS ↓", style=label.style_label_up, color=color.blue, textcolor=color.white, yloc=yloc.belowbar)
// === CHoCH (Change of Character) detection ===
var int trend = 0 // 1 = uptrend, -1 = downtrend
if hh or hl
trend := 1
if lh or ll
trend := -1
chochUp = trend == -1 and bosUp
chochDown = trend == 1 and bosDown
if showCHoCH and chochUp
label.new(bar_index, high, "CHoCH ↑", style=label.style_label_down, color=color.lime, textcolor=color.white, yloc=yloc.abovebar)
if showCHoCH and chochDown
label.new(bar_index, low, "CHoCH ↓", style=label.style_label_up, color=color.lime, textcolor=color.white, yloc=yloc.belowbar)
// === Arrows for signals ===
plotshape(bosUp, title="BOS Buy Arrow", location=location.belowbar, color=color.blue, style=shape.labelup, size=size.small, text="↑ BOS")
plotshape(bosDown, title="BOS Sell Arrow", location=location.abovebar, color=color.blue, style=shape.labeldown, size=size.small, text="↓ BOS")
plotshape(chochUp, title="CHoCH Buy Arrow", location=location.belowbar, color=color.lime, style=shape.labelup, size=size.small, text="↑ CHoCH")
plotshape(chochDown, title="CHoCH Sell Arrow", location=location.abovebar, color=color.lime, style=shape.labeldown, size=size.small, text="↓ CHoCH")
开源脚本
本着TradingView的真正精神,此脚本的创建者将其开源,以便交易者可以查看和验证其功能。向作者致敬!虽然您可以免费使用它,但请记住,重新发布代码必须遵守我们的网站规则。
免责声明
这些信息和出版物并不意味着也不构成TradingView提供或认可的金融、投资、交易或其它类型的建议或背书。请在使用条款阅读更多信息。
开源脚本
本着TradingView的真正精神,此脚本的创建者将其开源,以便交易者可以查看和验证其功能。向作者致敬!虽然您可以免费使用它,但请记住,重新发布代码必须遵守我们的网站规则。
免责声明
这些信息和出版物并不意味着也不构成TradingView提供或认可的金融、投资、交易或其它类型的建议或背书。请在使用条款阅读更多信息。