INVITE-ONLY SCRIPT
Executer
Executer helps to be a disciplined trader by providing the rules for execution.
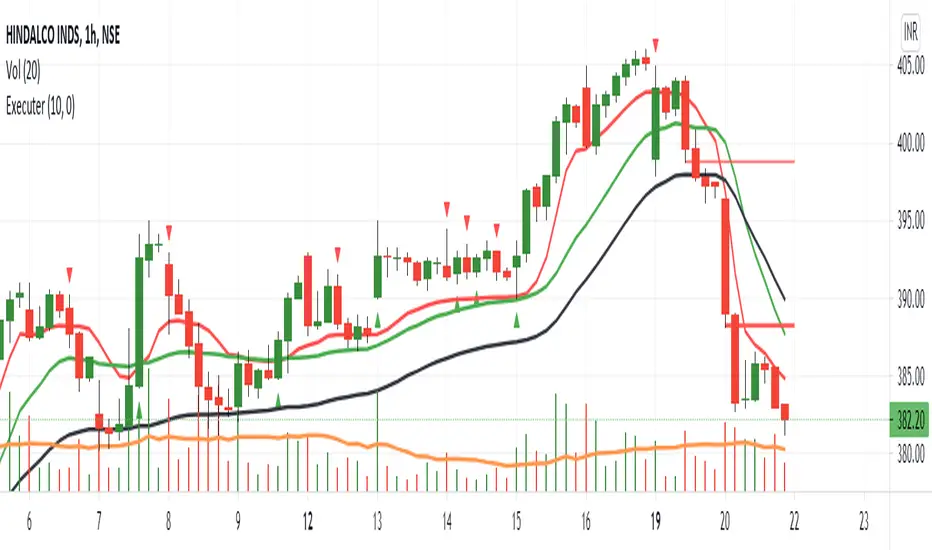
1. Triangle down and up symbol : One can consider this as 1st point of confirmation. This considers the volume and momentum.
2. Moving average band ( To identify the trend ) : When the red line is above all the other lines means trend is up or positive, so buy only when trend is UP.
Red line is below all other line means Trend is negative or Down, consider always to sell when trend is negative.
When redline is between green and black then trend is sideways or you may expect a big move and risk to reward ratio will be better in this type of setup.
When the red line is up then black line acts as Stop loss point.
3. Horizontal lines : Dynamic horizontal lines acts as booster to the trend or safe buying or selling point. This analyze the trend, candle strength and momentum to give the buying point or selling point. Here 1st thin line shows the start of trend and thick line shows the strong trend. Lines get deleted when the buying or selling point is invalid or one may consider the fresh points.
This helps to eliminate lot of sideways trends.
This indicator is fully customizable based on your requirement.
Consider more signal option if you don't want to miss the opportunity. If you are safe trader then no need of that.
仅限邀请脚本
仅限作者授权的用户访问此脚本,并且通常需要付费。您可以将其添加到收藏中,但是只有在向作者请求并获得许可之后,才能使用它。 请联系SupplyIsInDemand了解更多信息,或按照以下作者的说明操作。
TradingView不建议付费使用脚本,除非您100%信任作者并了解脚本的工作原理。在许多情况下,您可以在我们的社区脚本免费找到不错的开源替代方案。
作者的说明
″DM me for more information.
想在图表上使用此脚本?
警告:请在申请访问权限之前阅读。
免责声明
这些信息和出版物并不意味着也不构成TradingView提供或认可的金融、投资、交易或其它类型的建议或背书。请在使用条款阅读更多信息。