OPEN-SOURCE SCRIPT
IU Support and Resistance
How this script works :
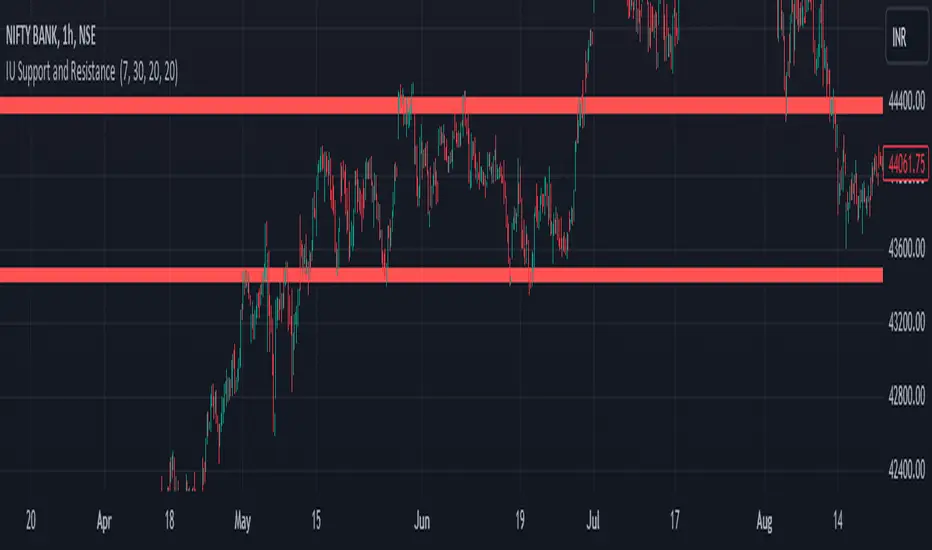
1. This script is an indicator script which calculates the support and resistance based on pivot high and pivot low and plot them as zone onto the chart.
2. The first user input is minimum number of touches which indicates how many time pivot high or pivot low should be tested in order to be a valid support or resistance level.
3.The second user input "Set Buffer" check if the user wants to use a custom buffer or not if it's unchanged then the default is 50% of the 1000 period ATR value .
4. If "Set Buffer" is checked meaning if it's set to true then only the third user input will be execute which is the "buffer" which indicates how much price range user wants his zone to have.
5. After the user input part this script create two arrays to store the pivot high and pivot low values every time he have a new value.
6. This script also creates two arrays to store the bar index of the bar where the new pivot high or pivot low is detected those bar index will be later use while creating the support and resistance zones.
7. Then the script creates four more arrays to store the final support and resistance values and their respective bar index which will be use for creating the support and resistance zones.
8. After this the script check that we are at the last bar of our chart if we are then we sort the support and resistance indices by descending order and store them into an new variable after that we sort the support and resistance arrays by descending order, then we loop through the arrays elements and we check if the previous element comes under the zone of the current element if so we increase the "minimum touch" variable by 1, once we have 5 or more count in our variable and we no longer have a valid zone then we store the element value and the sorted index of the element into our final arrays.
9. Finally the script will loop through the final support and resistance arrays and it will create a box for each support and resistance with respect to extending it on both directions.
10.The green zones are the support and the red zones are the resistance.
How user can benifits from this script:
1. User can automatically identify support and resistance zones and he can plan his trade as per that.
2. User can test how different markets reacts with support and resistance zones.
3. User can plan breakout trade on the break of the support or resistance level.
4. User can adjust he stop loss and take profit as per the support and resistance zones.
开源脚本
秉承TradingView的精神,该脚本的作者将其开源,以便交易者可以查看和验证其功能。向作者致敬!您可以免费使用该脚本,但请记住,重新发布代码须遵守我们的网站规则。
Shivam mandai
免责声明
这些信息和出版物并非旨在提供,也不构成TradingView提供或认可的任何形式的财务、投资、交易或其他类型的建议或推荐。请阅读使用条款了解更多信息。
开源脚本
秉承TradingView的精神,该脚本的作者将其开源,以便交易者可以查看和验证其功能。向作者致敬!您可以免费使用该脚本,但请记住,重新发布代码须遵守我们的网站规则。
Shivam mandai
免责声明
这些信息和出版物并非旨在提供,也不构成TradingView提供或认可的任何形式的财务、投资、交易或其他类型的建议或推荐。请阅读使用条款了解更多信息。