OPEN-SOURCE SCRIPT
已更新 4x Stochastic and 1x RSI Buy and Sell Signals
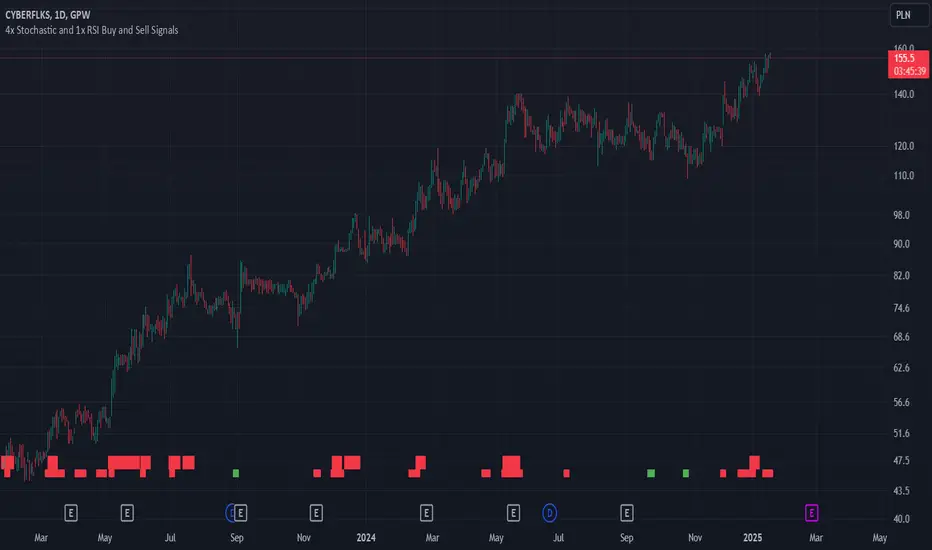
Buy signal (green), when Stochastic 9, 14, 40 and 60 are bellow 20.
Sell signal (red), when Stochastic 9, 14, 40 and 60 are above 80.
Buy signal is larger, when RSI is also bellow 30.
Sell signal is larger, when RSI is also above 70.
Using RSI is optional and can be disabled.
Use this signals when confirmed by another indicators, like support and resistance levels, EMAs and fundamental analysis.
版本注释
The script was created to simplify the analysis of four Stochastic indicators and one RSI simultaneously, combining them into a single coherent buy or sell signal. The script is suitable for trading any asset: stocks, futures, currencies. The goal is to identify a local price low or high to indicate a potential moment for buying or selling (long or short positions).The intended use of the script assumes the simultaneous utilization of four Stochastic indicators on four different timeframes. By default, these are 9, 14, 40, and 60. The indicator helps identify price lows or highs if all four Stochastic indicators are below 20 or above 80.
- Buy Signal (green rectangle at the bottom of the screen): Triggered when all four Stochastic indicators are below 20.
- Sell Signal (red rectangle at the bottom of the screen): Triggered when all four Stochastic indicators are above 80.
An additional optional parameter is the RSI, which serves to strengthen the signal from the Stochastic indicators. If the Stochastic indicators show a buy or sell signal and the RSI simultaneously indicates oversold or overbought conditions, the buy or sell signal is displayed as a larger rectangle at the bottom of the screen.
Usage Strategy:
Looking for deeper price lows or highs should be supplemented with confirmation from other methods. Recommended tools include Price Action analysis, support and resistance analysis, and fundamental analysis of the company.
版本注释
I added an option to disable the display of sell signals (red). As a result, only buy signals (green) appear.Strategy for the stock market:
The option to disable sell signals is useful in the stock market, as the stocks of good companies are typically in a long-term upward trend, leading to frequent false sell signals. Growth stocks tend to remain in the upper ranges of the Stochastic and often the RSI for extended periods. This is not a sell signal.
Strategy for currencies, commodities, and short selling:
Both sell and buy signals will be useful in these cases.
开源脚本
秉承TradingView的精神,该脚本的作者将其开源,以便交易者可以查看和验证其功能。向作者致敬!您可以免费使用该脚本,但请记住,重新发布代码须遵守我们的网站规则。
免责声明
这些信息和出版物并非旨在提供,也不构成TradingView提供或认可的任何形式的财务、投资、交易或其他类型的建议或推荐。请阅读使用条款了解更多信息。
免责声明
这些信息和出版物并非旨在提供,也不构成TradingView提供或认可的任何形式的财务、投资、交易或其他类型的建议或推荐。请阅读使用条款了解更多信息。