PROTECTED SOURCE SCRIPT
VIX Delta Sentiment
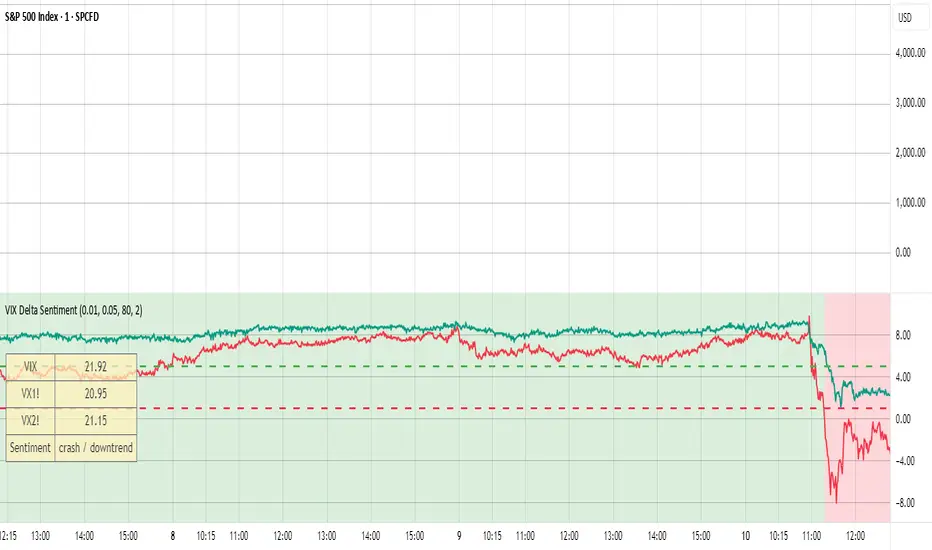
This script opens a new panel underneath the main panel.
It displays a table with the values of the CBOE volatility index VIX, which measures the last 30 days implied volatility of the S&P500 index, the VX1! and the VX2! values, which are the front month and the second month VIX futures.
To curves are plotted: the relative difference or delta of the two VIX futures as well as the relative delta between VIX and the first futures month. The dotted lines visualize the thresholds of these two relative deltas.
These values are needed to determine the market sentiment and to trigger a crash alert before it happens. It can be used to trade the major indices SPX, QQQ, etc. or to avoid catastrophic losses.
The market sentiment is annotated in the table and also visualized as background color.
受保护脚本
此脚本以闭源形式发布。 但是,您可以自由使用,没有任何限制 — 了解更多信息这里。
免责声明
这些信息和出版物并非旨在提供,也不构成TradingView提供或认可的任何形式的财务、投资、交易或其他类型的建议或推荐。请阅读使用条款了解更多信息。
受保护脚本
此脚本以闭源形式发布。 但是,您可以自由使用,没有任何限制 — 了解更多信息这里。
免责声明
这些信息和出版物并非旨在提供,也不构成TradingView提供或认可的任何形式的财务、投资、交易或其他类型的建议或推荐。请阅读使用条款了解更多信息。