OPEN-SOURCE SCRIPT
已更新 RDX Relative Directional Index
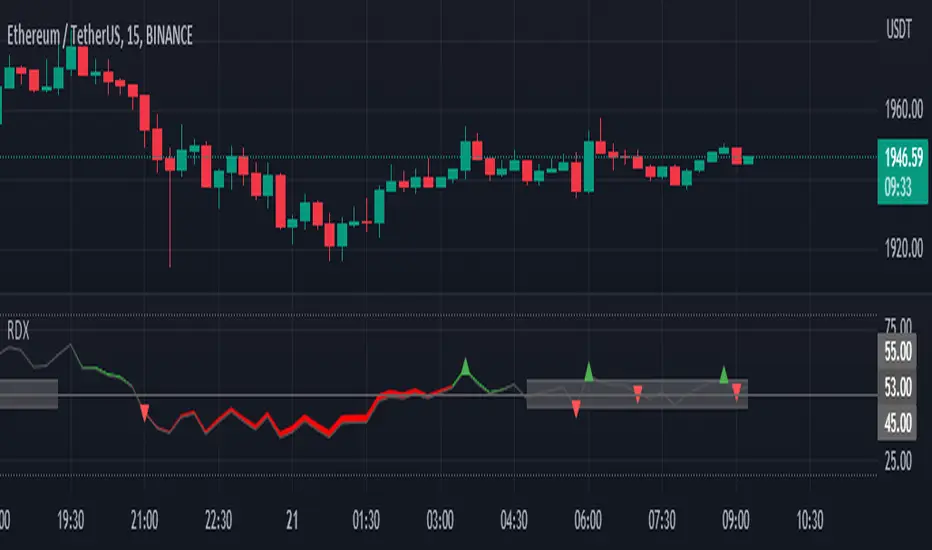
RDX Relative Directional Index, Strength + Direction + Trend. This indicator is the combination of RSI and DMI or ADX. RDX aims at providing Relative direction of the price along with strength of the trend. This acts as both RSI and Average Directional Index. as the strength grows the RSI line becomes wider and when there is high volatility and market fluctuation the line becomes thinner. Color decides the Direction. This indicator provides sideways detection of RSI signal.
RDX Width: This determines the strength of RSI and Strength of ADX, The strength grows RDX band grows wider, as strength decreases band shrinks and merge into the RSI line. for exact working simply disable RSI plot on the indicator. when there is no strength the RSI vanishes..
Technical:
RSI : with default 14 period
ADX : Default 14 period
RDX=RSI+(ADX-20)/5
Color Code:
Red: Down Direction
Green: Up Direction
Sideways:
A rectangular channel is plotted on RSI 50 Level
Oversold Overbought:
Oversold and Overbought Levels are plotted for normal RSI Oversold and Overbought detection.
Buy/Sell:
Buy sell signals from ADX crossover are plotted and its easy to determine
Strength + Direction + Trend in one go
Hope the community likes this...
Contibute for more ideas and indicators..
版本注释
minor update版本注释
go Live开源脚本
秉承TradingView的精神,该脚本的作者将其开源,以便交易者可以查看和验证其功能。向作者致敬!您可以免费使用该脚本,但请记住,重新发布代码须遵守我们的网站规则。
免责声明
这些信息和出版物并非旨在提供,也不构成TradingView提供或认可的任何形式的财务、投资、交易或其他类型的建议或推荐。请阅读使用条款了解更多信息。
开源脚本
秉承TradingView的精神,该脚本的作者将其开源,以便交易者可以查看和验证其功能。向作者致敬!您可以免费使用该脚本,但请记住,重新发布代码须遵守我们的网站规则。
免责声明
这些信息和出版物并非旨在提供,也不构成TradingView提供或认可的任何形式的财务、投资、交易或其他类型的建议或推荐。请阅读使用条款了解更多信息。