PROTECTED SOURCE SCRIPT
TB Sniper
Welcome everyone to your new base indicator, the TB Sniper.
Want to catch market tops and bottoms? You're in the right place!
Be ahead of of the game with the ability to catch market tops and bottoms.
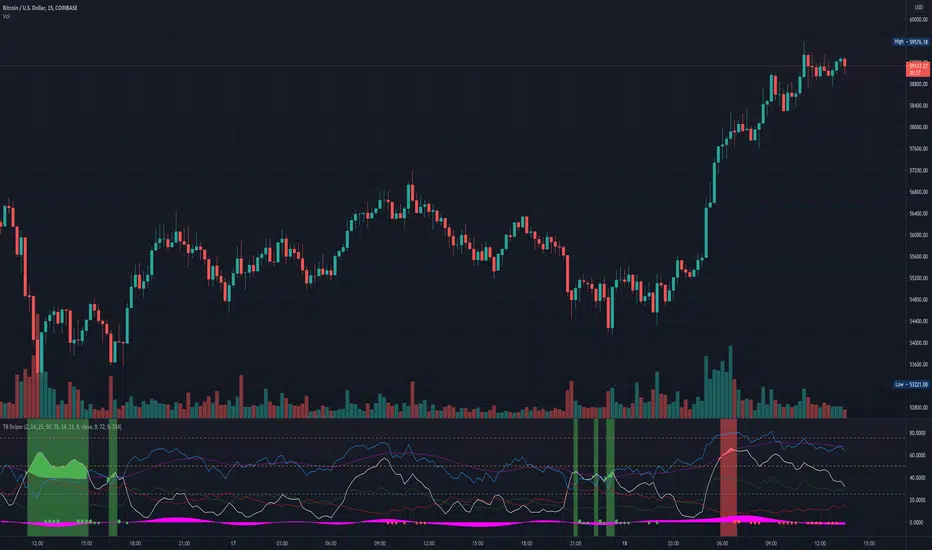
This indicator combines a range of momentum and oscillation indicators to give you a decent chance of catching the highs and lows, relative to the timeframe it is used on. This information is critical in analysing where to buy and sell and to give you a view of the overall health of the pair you are trading.
In addition to finding the relative tops and bottoms, it also shows you the RSI, DMI and MACD histogram for further confluence in your decision making.
The indicator will flash a green background when it thinks it is close to a bottom or a red background when it thinks it is close to a top. Further indications are shown when the indicator thinks it is now a good time to buy (large green circle shown) or sell (large red circle shown). These large circles work very well when longing/shorting the market and when overall price action is in the direction of the signal. E.g. In an uptrend, a large green circle will indicate a good time to buy/long. In a downtrend, a red circle will indicate a good time to sell/short. The indicator will show auxiliary indications (small circles) when it thinks it would be a good time to take profit. A small green circle indicates a possible time to take profit after buying/longing, while a small red circle indicates a possible time to take profit after selling/shorting.
This script works very well on the 15 minute timeframe with the default settings on most symbols, especially cryptocurrency. Usually, the larger the timeframe, the bigger the move.
Want to catch market tops and bottoms? You're in the right place!
Be ahead of of the game with the ability to catch market tops and bottoms.
This indicator combines a range of momentum and oscillation indicators to give you a decent chance of catching the highs and lows, relative to the timeframe it is used on. This information is critical in analysing where to buy and sell and to give you a view of the overall health of the pair you are trading.
In addition to finding the relative tops and bottoms, it also shows you the RSI, DMI and MACD histogram for further confluence in your decision making.
The indicator will flash a green background when it thinks it is close to a bottom or a red background when it thinks it is close to a top. Further indications are shown when the indicator thinks it is now a good time to buy (large green circle shown) or sell (large red circle shown). These large circles work very well when longing/shorting the market and when overall price action is in the direction of the signal. E.g. In an uptrend, a large green circle will indicate a good time to buy/long. In a downtrend, a red circle will indicate a good time to sell/short. The indicator will show auxiliary indications (small circles) when it thinks it would be a good time to take profit. A small green circle indicates a possible time to take profit after buying/longing, while a small red circle indicates a possible time to take profit after selling/shorting.
This script works very well on the 15 minute timeframe with the default settings on most symbols, especially cryptocurrency. Usually, the larger the timeframe, the bigger the move.
受保护脚本
此脚本以闭源形式发布。 但是,您可以自由使用,没有任何限制 — 了解更多信息这里。
免责声明
这些信息和出版物并非旨在提供,也不构成TradingView提供或认可的任何形式的财务、投资、交易或其他类型的建议或推荐。请阅读使用条款了解更多信息。
受保护脚本
此脚本以闭源形式发布。 但是,您可以自由使用,没有任何限制 — 了解更多信息这里。
免责声明
这些信息和出版物并非旨在提供,也不构成TradingView提供或认可的任何形式的财务、投资、交易或其他类型的建议或推荐。请阅读使用条款了解更多信息。