OPEN-SOURCE SCRIPT
已更新 Normalized Quantitative Qualitative Estimation nQQE
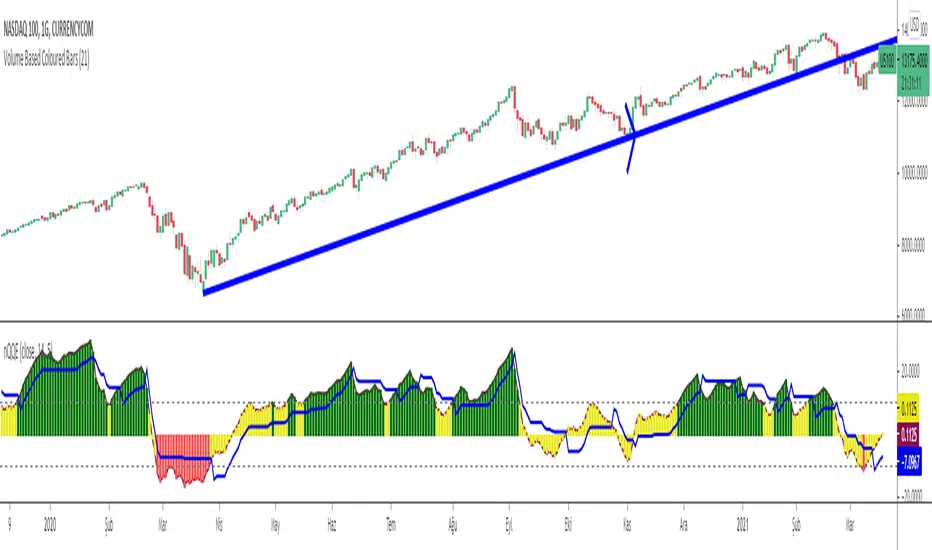
Normalized version of Quantitative Qualitative Estimation QQE:

Normalized QQE tries to overcome the problems of false signals due to RSI divergences on the original QQE indicator.

The main purpose is to determine and ride the trend as far as possible.
So users can identify:
UPTREND : when nQQE Histogram is GREEN (nQQE is above 10)
DOWNTREND : when nQQE Histogram is RED (nQQE is below -10)
SIDEWAYS: when nQQE Histogram is YELLOW (nQQE is between -10 and 10)
Calculation is very simple;
RSI based QQE oscillates between 0-100
nQQE is simply calculated as:
nQQE=QQE-50
to make the indicator fluctuate around 0 level to get more accurate signals.
Various alarms added.
Kıvanç Özbilgiç
Normalized QQE tries to overcome the problems of false signals due to RSI divergences on the original QQE indicator.
The main purpose is to determine and ride the trend as far as possible.
So users can identify:
UPTREND : when nQQE Histogram is GREEN (nQQE is above 10)
DOWNTREND : when nQQE Histogram is RED (nQQE is below -10)
SIDEWAYS: when nQQE Histogram is YELLOW (nQQE is between -10 and 10)
Calculation is very simple;
RSI based QQE oscillates between 0-100
nQQE is simply calculated as:
nQQE=QQE-50
to make the indicator fluctuate around 0 level to get more accurate signals.
Various alarms added.
Kıvanç Özbilgiç
版本注释
deleted dummy parts开源脚本
秉承TradingView的精神,该脚本的作者将其开源,以便交易者可以查看和验证其功能。向作者致敬!您可以免费使用该脚本,但请记住,重新发布代码须遵守我们的网站规则。
Telegram t.me/AlgoRhytm
YouTube (Turkish): youtube.com/c/kivancozbilgic
YouTube (English): youtube.com/c/AlgoWorld
YouTube (Turkish): youtube.com/c/kivancozbilgic
YouTube (English): youtube.com/c/AlgoWorld
免责声明
这些信息和出版物并非旨在提供,也不构成TradingView提供或认可的任何形式的财务、投资、交易或其他类型的建议或推荐。请阅读使用条款了解更多信息。
开源脚本
秉承TradingView的精神,该脚本的作者将其开源,以便交易者可以查看和验证其功能。向作者致敬!您可以免费使用该脚本,但请记住,重新发布代码须遵守我们的网站规则。
Telegram t.me/AlgoRhytm
YouTube (Turkish): youtube.com/c/kivancozbilgic
YouTube (English): youtube.com/c/AlgoWorld
YouTube (Turkish): youtube.com/c/kivancozbilgic
YouTube (English): youtube.com/c/AlgoWorld
免责声明
这些信息和出版物并非旨在提供,也不构成TradingView提供或认可的任何形式的财务、投资、交易或其他类型的建议或推荐。请阅读使用条款了解更多信息。