INVITE-ONLY SCRIPT
Fibonacci Dashboard-xbos.in
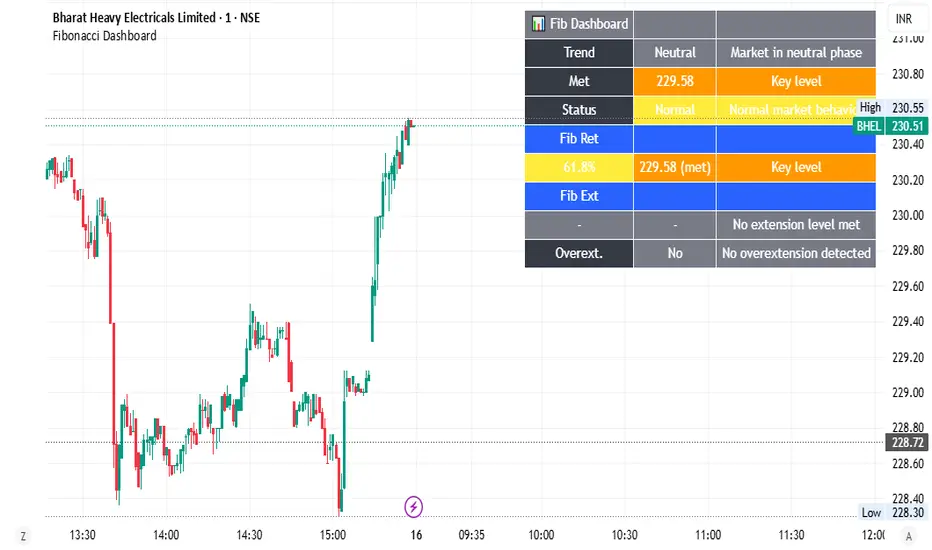
This Fibonacci Dashboard is a technical tool built in Pine Script that helps traders track key Fibonacci retracement and extension levels. It automatically detects the market trend—uptrend, downtrend, or neutral—and displays it with color-coded signals for easy interpretation.
It calculates retracement and extension levels from recent swing highs and lows, helping traders identify where price pullbacks or trend continuations are likely to occur. The retracement levels, like 0.236, 0.382, and 0.618, highlight areas where the price might temporarily correct, while extension levels, such as 1.272 and 1.618, point to zones of breakout or strong momentum.
The dashboard summarizes the current trend, the last Fibonacci level touched, and whether the structure is breaking or behaving normally. Traders can also set alerts on specific levels to be notified when price approaches or crosses them, ensuring timely action.
Additionally, the dashboard is customizable—you can adjust its position, choose which levels to display, and set thresholds for alerts. This makes it a flexible and user-friendly tool for analyzing trends and planning trades efficiently.Main Features
Trend Detection
Identifies whether the market is in an Uptrend, Downtrend, or Neutral based on price movements.
Highlights trends with color-coded signals:
✅ Green → Uptrend
❌ Red → Downtrend
⚪ Gray → Neutral
Fibonacci Levels
Calculates both retracement and extension levels from swing highs and lows.
Helps identify where price corrections and continuations might occur.
Retracement Levels
Shows key Fibonacci retracement ratios:
Extension Levels
Shows key Fibonacci extension ratios
Dashboard Display
Summarizes trend, last met Fibonacci level, and overall market structure.
Provides details about whether the price is at a retracement or extension level and what it means.
Status field signals whether the structure is breaking, a breakout is occurring, or the market is behaving normally.
Alerts
You can set alerts on specific retracement and extension levels.
Alerts are triggered when the price crosses or approaches these levels within a tolerance threshold.
Customization
Dashboard position can be adjusted (top-right, top-left, bottom-right, bottom-left).
Volume threshold for triggering alerts is customizable.
Show/hide retracements and extensions.
仅限邀请脚本
只有经作者批准的用户才能访问此脚本。您需要申请并获得使用权限。该权限通常在付款后授予。如需了解更多详情,请按照以下作者的说明操作,或直接联系xbos。
除非您完全信任其作者并了解脚本的工作原理,否則TradingView不建议您付费或使用脚本。您还可以在我们的社区脚本中找到免费的开源替代方案。
作者的说明
The Fibonacci Dashboard is a user-friendly tool that tracks key retracement and extension levels, identifies market trends with color-coded signals, and provides customizable alerts to help traders plan entries and exits more effectively.
Powered by XBOS – Technical setups made simple 📈 | xbos.in
免责声明
这些信息和出版物并不意味着也不构成TradingView提供或认可的金融、投资、交易或其它类型的建议或背书。请在使用条款阅读更多信息。