PROTECTED SOURCE SCRIPT
Volume Vision
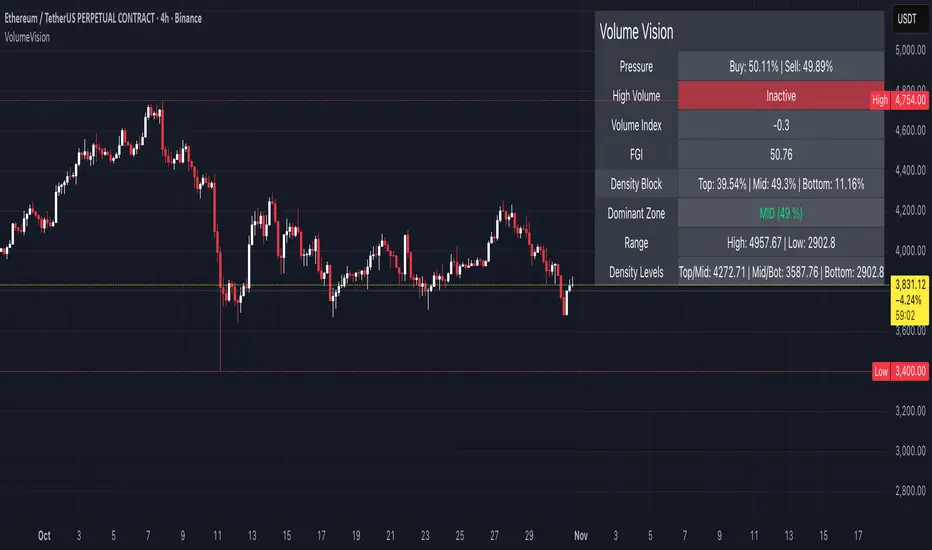
Volume Vision is a precision volume-analysis system that exposes how trading activity is distributed inside the current market range.
It divides the active price structure into three live zones — Top, Middle, and Bottom — and measures where real participation is concentrated.
This creates a dynamic “volume map” that allows you to instantly see whether the market is being driven by accumulation, distribution, or equilibrium.
At the heart of the indicator is a fully original implementation of the FGI — a proprietary composite metric designed to read market emotion and internal pressure.
It transforms several hidden components — volume, volatility, dominance, and directional momentum — into one unified curve of sentiment.
FGI values around 30 typically reflect phases of fear, capitulation, and potential accumulation.
Values near 80 mark conditions of greed, overextension, and possible distribution.
Observing these boundaries helps detect when the market is preparing to shift from compression to expansion or from euphoria to cooling.
Core Functions
Density Zones: Splits recent price movement into Top / Mid / Bottom areas, quantifying volume within each.
Dominant Zone: Highlights where the major share of liquidity currently resides.
Pressure Meter: Shows the balance between buy and sell volume in real time.
Volume Index: Normalizes present volume activity against its historical range to spot abnormal behaviour.
FGI Reading: Custom sentiment curve ranging from fear (≈ 30) to greed (≈ 80).
Alerts: Optional signals for High Volume and Rising Volume moments.
Dashboard: Compact on-chart table that summarizes all key readings without cluttering the view.
Interpretation Guide
When FGI drops near 30, the market often forms accumulation bases or bottom structures.
When FGI climbs toward 80, momentum usually reaches its limit and profit-taking or distribution begins.
A dominant Top zone with strong sell pressure indicates distribution, while Bottom dominance with buy pressure suggests accumulation.
Mid-zone dominance with neutral FGI reflects balance — a state of indecision before the next move.
Watch for volume spikes accompanied by FGI shifts: these often precede major impulse starts or ends.
Style: non-repainting core, minimal visuals, real-time clarity.
Created for traders who need to see where the energy is flowing, not just what price is printing.
https://www.tradingview.com/x/5Bg9Sy0U/
by MahaTrend
受保护脚本
此脚本以闭源形式发布。 但是,您可以自由使用,没有任何限制 — 了解更多信息这里。
免责声明
这些信息和出版物并非旨在提供,也不构成TradingView提供或认可的任何形式的财务、投资、交易或其他类型的建议或推荐。请阅读使用条款了解更多信息。
免责声明
这些信息和出版物并非旨在提供,也不构成TradingView提供或认可的任何形式的财务、投资、交易或其他类型的建议或推荐。请阅读使用条款了解更多信息。