OPEN-SOURCE SCRIPT
Ultra Disparity Index
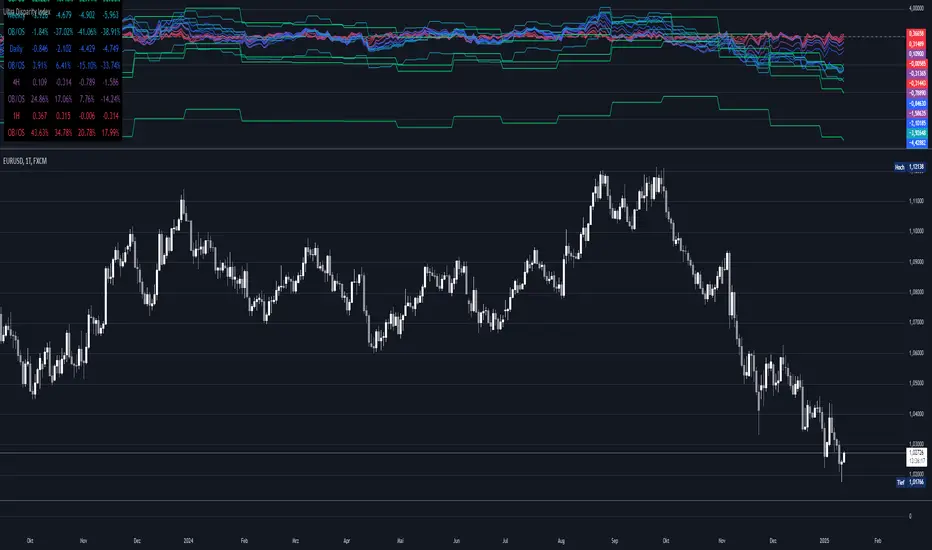
Gain insights into price movements across multiple timeframes with the Ultra Disparity Index. This indicator highlights overbought/oversold levels based on price disparities from moving averages.
Introduction
The Ultra Disparity Index is designed for traders who seek a deeper understanding of price movements and trends across various timeframes. By analyzing the disparity between the current price and its moving averages, the indicator helps identify overbought and oversold conditions.
Detailed Description
The indicator works by calculating the percentage difference between the current price and its moving averages over four user-defined lengths. It operates on multiple timeframes monthly, weekly, daily, 4-hour, and 1-hour giving traders a comprehensive view of market dynamics.
.........
.........
Summary
The indicator uses simple moving averages (SMAs) as a benchmark for calculating disparity. This disparity is then analyzed using statistical tools, such as standard deviation, to derive meaningful levels. Finally, the results are visualized in a table, providing traders with an easy-to-read summary of disparity values and their respective normalized percentages.
Introduction
The Ultra Disparity Index is designed for traders who seek a deeper understanding of price movements and trends across various timeframes. By analyzing the disparity between the current price and its moving averages, the indicator helps identify overbought and oversold conditions.
Detailed Description
The indicator works by calculating the percentage difference between the current price and its moving averages over four user-defined lengths. It operates on multiple timeframes monthly, weekly, daily, 4-hour, and 1-hour giving traders a comprehensive view of market dynamics.
.........
- Disparity Calculation
The indicator computes how far the current price is from moving averages to reveal the degree of disparity.
..... - Overbought/Oversold Zones
By normalizing disparities into percentages relative to the overbought/oversold range, the indicator represents overbought (100%) and oversold (-100%).
..... - Timeframe Flexibility
The user can visualize data from monthly to hourly intervals, ensuring adaptability to different trading strategies.
..... - Customizable Inputs
Users can configure moving average lengths and toggle visibility for specific timeframes and levels.
.........
Summary
The indicator uses simple moving averages (SMAs) as a benchmark for calculating disparity. This disparity is then analyzed using statistical tools, such as standard deviation, to derive meaningful levels. Finally, the results are visualized in a table, providing traders with an easy-to-read summary of disparity values and their respective normalized percentages.
开源脚本
秉承TradingView的精神,该脚本的作者将其开源,以便交易者可以查看和验证其功能。向作者致敬!您可以免费使用该脚本,但请记住,重新发布代码须遵守我们的网站规则。
免责声明
这些信息和出版物并非旨在提供,也不构成TradingView提供或认可的任何形式的财务、投资、交易或其他类型的建议或推荐。请阅读使用条款了解更多信息。
免责声明
这些信息和出版物并非旨在提供,也不构成TradingView提供或认可的任何形式的财务、投资、交易或其他类型的建议或推荐。请阅读使用条款了解更多信息。