INVITE-ONLY SCRIPT
RG+B [Intromoto]

Hey folks.
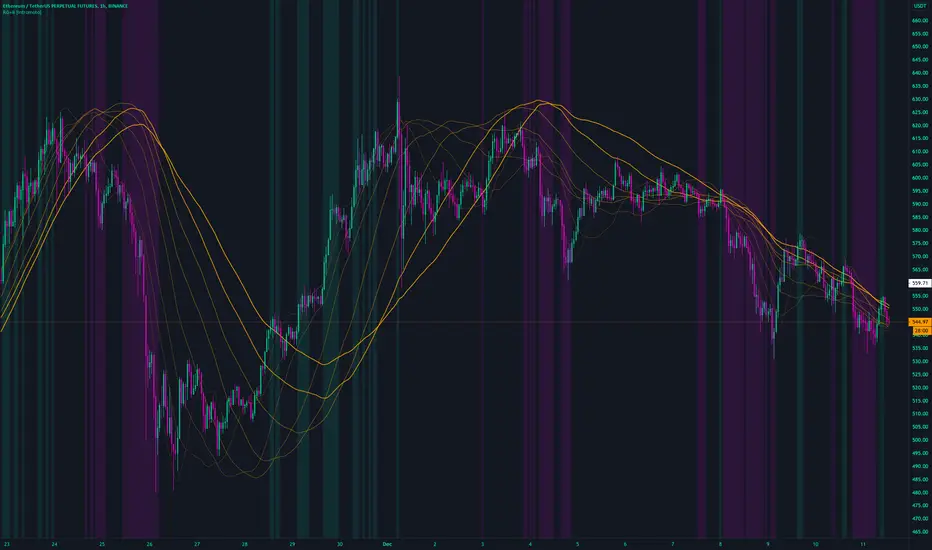
This is an experimental guppy formed from regression lines, instead of the normal EMAs. There are 8 regression plots in total, starting from 25, and progressing in increments of 25, ending in 200.
I've added a bias color in the background to assist in trend directions for when price is above all regression lines or below all regression lines.
Please DM me for trial/access.
Thanks.
DM for access.
Follow on Twitter for updates.
One time fee, no subscription
twitter.com/IntroMoto
Follow on Twitter for updates.
One time fee, no subscription
twitter.com/IntroMoto
免责声明
这些信息和出版物并不意味着也不构成TradingView提供或认可的金融、投资、交易或其它类型的建议或背书。请在使用条款阅读更多信息。