OPEN-SOURCE SCRIPT
已更新 Up Down Volatility
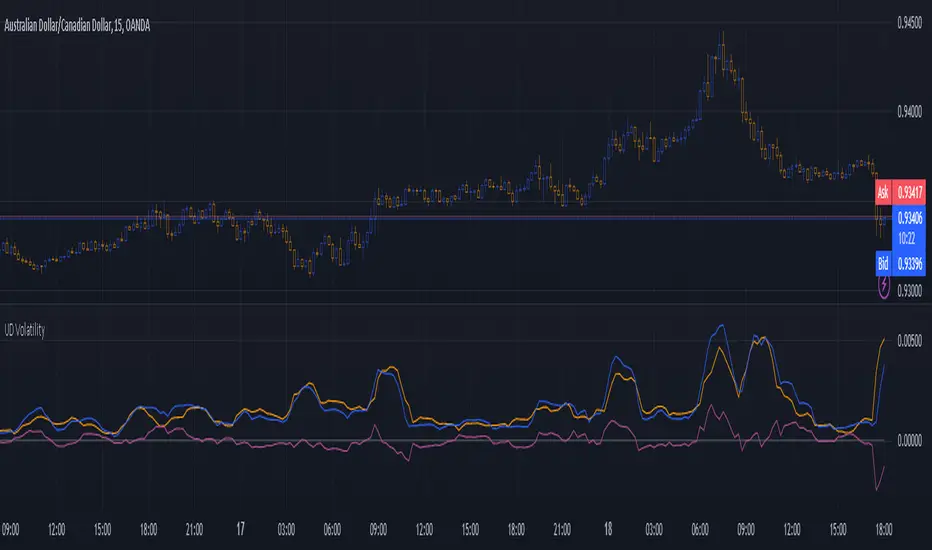
This is just experimental. I wanted the flexibility in looking at volatility and this indicator gives you several ways to do so.
I haven't figured out the best way to use this yet but I suspect that as a form of entry confirmation indicator would be best.
If you find a way this works well for you please drop me a note. It would nice know someone found a way to use it successfully!
The options available are:
* Your source can be price or the ATR.
* It allows you to separate the volatility of the bearish and bullish candles and even allows you to produce differential.
* You can choose to run the result through any one of many smoothers.
With the above options you can look at:
* The normal volatility. That is not split into bearish and bullish components.
* The bearish and bullish volatility and the difference between them.
* The relative bearish and bullish volatility and the difference between them.
The "The relative bearish and bullish" is each one divided into the source before it was split into Up and Down or low/high divided by close which should make the max value roughly around 1.
The code is structured to easily drop into a bigger system so use it as a lone indicator or add the code to some bigger project you are creating. If you do integrate it into something else then send me a note as it would be nice to know it's being well used.
Enjoy and good luck!
版本注释
Functionally the same. Just some labeling fixes.开源脚本
秉承TradingView的精神,该脚本的作者将其开源,以便交易者可以查看和验证其功能。向作者致敬!您可以免费使用该脚本,但请记住,重新发布代码须遵守我们的网站规则。
免责声明
这些信息和出版物并非旨在提供,也不构成TradingView提供或认可的任何形式的财务、投资、交易或其他类型的建议或推荐。请阅读使用条款了解更多信息。
免责声明
这些信息和出版物并非旨在提供,也不构成TradingView提供或认可的任何形式的财务、投资、交易或其他类型的建议或推荐。请阅读使用条款了解更多信息。