PROTECTED SOURCE SCRIPT
TradingBot - Multi-RSI Histogram & Signal Smoother
Multi-RSI Histogram & Signal Smoother
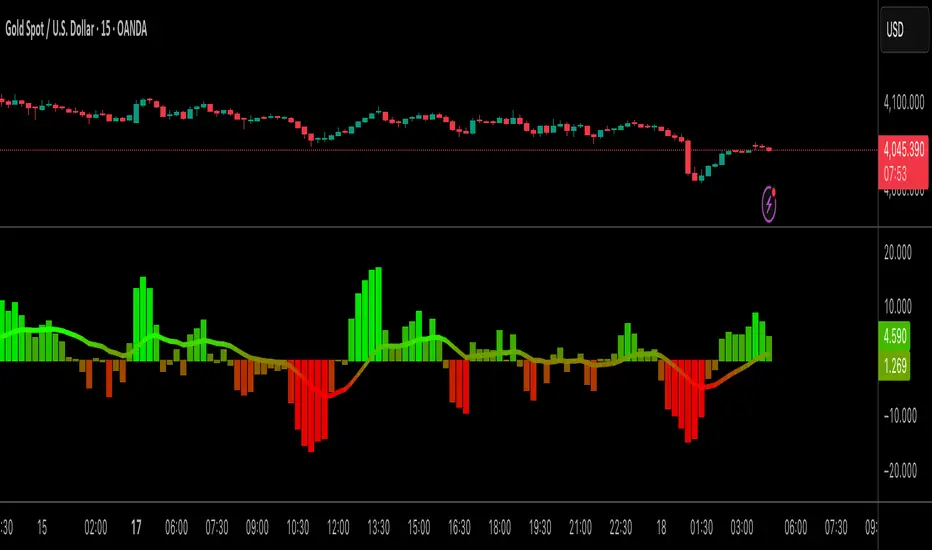
This indicator combines three RSI calculations and transforms their relative differences into a histogram, allowing users to observe shifts in momentum and market character in a structured, visual format. The goal of this tool is to present RSI-based relationships in a way that is easier to interpret compared to individual RSI lines, especially in environments where price moves between trending and ranging behaviour.
--------------------------------------------------------------------------------
How It Works (Objective Explanation)
--------------------------------------------------------------------------------
- The script calculates three RSI values using different lengths.
- It measures their relative differences (RSI3–RSI7, RSI7–RSI14, RSI3–RSI14).
- These three difference values are combined into a single histogram.
- A moving average (EMA) of the histogram is plotted to highlight short-term changes in the aggregated signal.
This approach allows users to view how multiple RSI speeds diverge or converge, which may help them evaluate momentum shifts. The histogram uses a gradient color scale purely for visual clarity.
--------------------------------------------------------------------------------
What the Indicator Shows (Non-Promotional)
--------------------------------------------------------------------------------
- Increasing histogram values simply mean the faster RSIs are rising relatively stronger than the slower RSIs.
- Decreasing histogram values indicate the opposite — fast RSIs weakening relative to slower ones.
- The EMA line smooths the raw histogram to make the changes easier to observe.
This indicator does not predict future price movement. It only reflects the real-time relationship between different RSI settings.
--------------------------------------------------------------------------------
Possible Use Cases (Allowed Under TradingView Rules)
--------------------------------------------------------------------------------
These are general technical-analysis use cases, not financial advice:
1. Identifying momentum compression or expansion
- When the histogram stays near zero, the different RSIs are close together.
- This may occur during consolidation phases.
2. Observing momentum transitions
- A shift from negative to positive values (or vice versa) shows a relative change in RSI behaviour.
- The EMA may help users track such transitions more smoothly.
3. Supporting existing strategies
- This indicator can be used as an additional layer of confirmation in systems that already rely on momentum or RSI-based tools.
- It should not be used as a standalone decision-making tool.
--------------------------------------------------------------------------------
Important Notes (Required for House-Rule Compliance)
--------------------------------------------------------------------------------
- This indicator does not generate buy or sell signals.
- It is not a guarantee of performance and should not be interpreted as financial advice.
- Past performance of any technical method does not ensure future outcomes.
- Users should test this script and adjust parameters based on their own preferences and trading approach.
受保护脚本
此脚本以闭源形式发布。 但是,您可以自由使用,没有任何限制 — 了解更多信息这里。
免责声明
这些信息和出版物并非旨在提供,也不构成TradingView提供或认可的任何形式的财务、投资、交易或其他类型的建议或推荐。请阅读使用条款了解更多信息。
受保护脚本
此脚本以闭源形式发布。 但是,您可以自由使用,没有任何限制 — 了解更多信息这里。
免责声明
这些信息和出版物并非旨在提供,也不构成TradingView提供或认可的任何形式的财务、投资、交易或其他类型的建议或推荐。请阅读使用条款了解更多信息。