OPEN-SOURCE SCRIPT
Red Pill VWAP/RSI Divergence

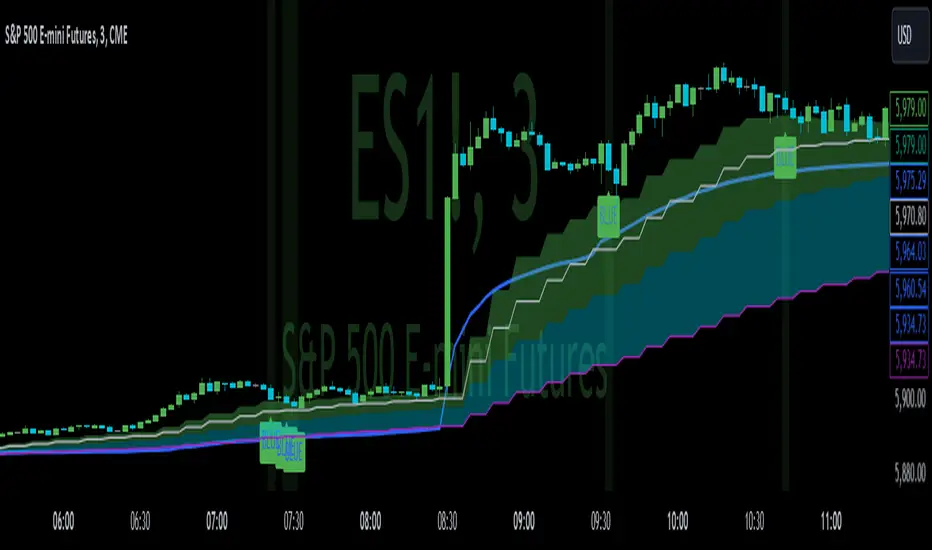
I created this indicator to identify moments in time VWAP and RSI are diverging.
Ideally useful in strong trend, bullish or bearish, as a potential entry point on a pull back for continuation. Not to be used as a stand alone signal, but rather in conjunction with any possible trend/momentum strategy.
VWAP is identified as the blue line. Green label(blue pill) is your potential entry on a pull back when price is above, stacked EMAS & VWAP for a long position. Red label(red pill) is your potential entry on a pull back when price is below inversely stacked EMAS & VWAP for a short position. These are the 2 ideal scenarios I have found. Please back test for yourself
I have had great results but must emphasis this is not a stand alone buy/sell. I use it in confluence to add conviction to my current A+ setups.
***Pivot ribbon in chart created by Saty Mahajan set to 3/10 time warp works ideal in conjunction.
***please note false positive and false negative signals can occur, particularly in chop
I hope you find this helpful . TRADE SAFE!
开源脚本
秉承TradingView的精神,该脚本的作者将其开源,以便交易者可以查看和验证其功能。向作者致敬!您可以免费使用该脚本,但请记住,重新发布代码须遵守我们的网站规则。
免责声明
这些信息和出版物并非旨在提供,也不构成TradingView提供或认可的任何形式的财务、投资、交易或其他类型的建议或推荐。请阅读使用条款了解更多信息。
开源脚本
秉承TradingView的精神,该脚本的作者将其开源,以便交易者可以查看和验证其功能。向作者致敬!您可以免费使用该脚本,但请记住,重新发布代码须遵守我们的网站规则。
免责声明
这些信息和出版物并非旨在提供,也不构成TradingView提供或认可的任何形式的财务、投资、交易或其他类型的建议或推荐。请阅读使用条款了解更多信息。