OPEN-SOURCE SCRIPT
已更新 Cosmic Angle

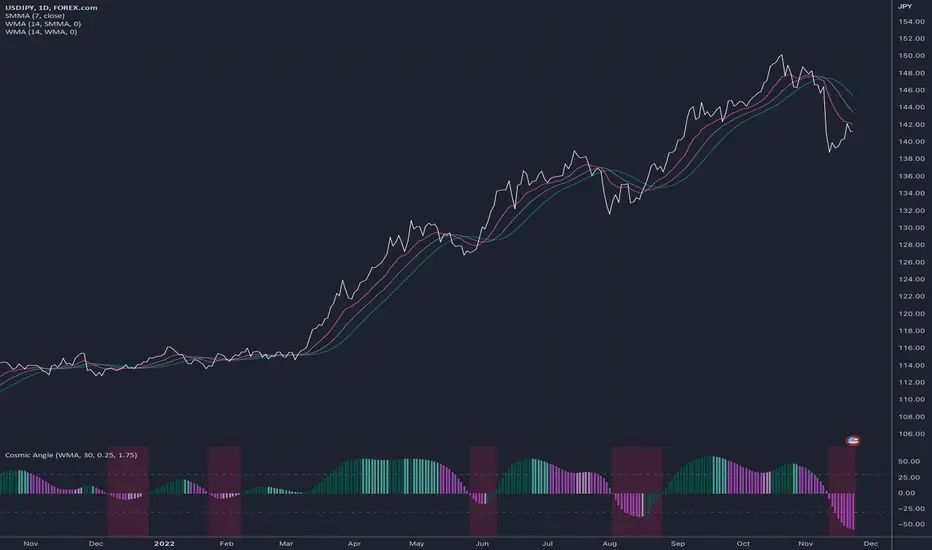
This is a histogram that can display a moving average's angle and also show how volatile the change in angle is.
To use:
(*1) This setting affects the bar colors. It represents the minimum difference in degrees between the n and n-1 bars' angle to force a change of color.
To use:
- Add any moving average indicator to the chart
- Click that indicator's More > Add Indicator on (MA)
- Select the Cosmic Angle indicator
- Adjust the Cosmic Angle's Price To Bar Ratio value to reflect that of your chart's
- Adjust the Cosmic Angle's Threshold as per your liking (*1)
(*1) This setting affects the bar colors. It represents the minimum difference in degrees between the n and n-1 bars' angle to force a change of color.
版本注释
UPDATES- Implemented Guides Position setting
- Updated example to use an extra "smoothing" moving average
NOTES
If your base moving average uses a short timeframe, the Cosmic Angle will likely look jagged and hard to read. An easy way to fix this problem is to add an extra moving average in between to smooth out the final output. In this example, a WMA with a short length of 9 is added onto the original SMMA and is then set as the source for the Cosmic Angle, producing a more relevant chart.
版本注释
- renamed get_degrees to get_slope
- updated slope calculation
- added bend plot
The bend shows when the slope itself is getting bigger or smaller. See the code for how to apply bend coloring to any moving average plot.
版本注释
Refactored the bend feature into a separate indicator called Cosmic Vector.版本注释
upgraded to version 5开源脚本
秉承TradingView的精神,该脚本的作者将其开源,以便交易者可以查看和验证其功能。向作者致敬!您可以免费使用该脚本,但请记住,重新发布代码须遵守我们的网站规则。
📣 Ask on Reddit: shorturl.at/BILRZ
👀 Watch on TikTok: shorturl.at/gzAPW
🚩 Disclaimer: the information created and published here is not prohibited, doesn't constitute investment advice, and isn't created solely for qualified investors
👀 Watch on TikTok: shorturl.at/gzAPW
🚩 Disclaimer: the information created and published here is not prohibited, doesn't constitute investment advice, and isn't created solely for qualified investors
免责声明
这些信息和出版物并非旨在提供,也不构成TradingView提供或认可的任何形式的财务、投资、交易或其他类型的建议或推荐。请阅读使用条款了解更多信息。
开源脚本
秉承TradingView的精神,该脚本的作者将其开源,以便交易者可以查看和验证其功能。向作者致敬!您可以免费使用该脚本,但请记住,重新发布代码须遵守我们的网站规则。
📣 Ask on Reddit: shorturl.at/BILRZ
👀 Watch on TikTok: shorturl.at/gzAPW
🚩 Disclaimer: the information created and published here is not prohibited, doesn't constitute investment advice, and isn't created solely for qualified investors
👀 Watch on TikTok: shorturl.at/gzAPW
🚩 Disclaimer: the information created and published here is not prohibited, doesn't constitute investment advice, and isn't created solely for qualified investors
免责声明
这些信息和出版物并非旨在提供,也不构成TradingView提供或认可的任何形式的财务、投资、交易或其他类型的建议或推荐。请阅读使用条款了解更多信息。