OPEN-SOURCE SCRIPT
Adaptive RSI Pro
# Adaptive RSI Pro / 自适应RSI专业版
[](https://www.tradingview.com/scripts/)
[](https://www.tradingview.com/pine-script-reference/v6/)
[](https://opensource.org/licenses/MIT)
Dynamic overbought/oversold thresholds + Multi-Timeframe analysis + Divergence detection + Signal statistics.
根据每个标的实际历史分布动态计算超买/超卖阈值,结合多时间框架分析、背离检测和信号统计。
**Pine Script v6** | **Last Update: 2025-12-17** | **v6.2**
---
## Emoji Legend / 信号图例
### Chart Signals / 图表信号
#### Buy Signals / 买入信号 (底部显示)
| Emoji | Signal Name | Condition | Priority | Action |
|-------|-------------|-----------|----------|--------|
| 🌟 | MTF + Extreme | 3+ timeframes oversold + Z<−2σ | ★★★★★ | **STRONG BUY** 强力买入 |
| 💎 | Divergence + Extreme | Bullish divergence in Z<−2σ zone | ★★★★☆ | **BUY** 买入 |
| 🔥 | Extreme Oversold | Z-Score crosses below −2σ (≈P2) | ★★★☆☆ | **BUY** 买入 |
| ⬆️ | Normal Oversold | Z-Score crosses below −1.5σ (≈P7) | ★★☆☆☆ | Consider buy 考虑买入 (默认隐藏) |
| ↗️ | Bullish Divergence | Price↓ RSI↑ (not in extreme zone) | ★☆☆☆☆ | Watch 观察 (潜在底部) |
#### Sell Signals / 卖出信号 (顶部显示)
| Emoji | Signal Name | Condition | Priority | Action |
|-------|-------------|-----------|----------|--------|
| 🌟 | MTF + Extreme | 3+ timeframes overbought + Z>+2σ | ★★★★★ | **STRONG SELL** 强力卖出 |
| 💎 | Divergence + Extreme | Bearish divergence in Z>+2σ zone | ★★★★☆ | **SELL** 卖出 |
| ❄️ | Extreme Overbought | Z-Score crosses above +2σ (≈P98) | ★★★☆☆ | **SELL** 卖出 |
| ⬇️ | Normal Overbought | Z-Score crosses above +1.5σ (≈P93) | ★★☆☆☆ | Consider sell 考虑卖出 (默认隐藏) |
| ↘️ | Bearish Divergence | Price↑ RSI↓ (not in extreme zone) | ★☆☆☆☆ | Watch 观察 (潜在顶部) |
> **Priority System / 优先级系统**: Only the highest priority signal is shown to prevent overlapping.
> 只显示最高优先级信号,避免叠加。
---
### Dashboard Status / 仪表盘状态
| Emoji | Status | Meaning |
|-------|--------|---------|
| 🟢 | EXTREME OVERSOLD | Z-Score < −2σ (≈P2.3), strong buy zone / 极端超卖区,强买区 |
| 🟡 | OVERSOLD | Z-Score < −1.5σ (≈P6.7), oversold / 超卖 |
| ⚪ | NEUTRAL | −1.5σ ≤ Z-Score ≤ +1.5σ, no signal / 中性,无信号 |
| 🟠 | OVERBOUGHT | Z-Score > +1.5σ (≈P93.3), overbought / 超买 |
| 🔴 | EXTREME OVERBOUGHT | Z-Score > +2σ (≈P97.7), strong sell zone / 极端超买区,强卖区 |
### MTF Status / 多周期状态
| Emoji | Meaning |
|-------|---------|
| 🟢 | Timeframe oversold / 该周期超卖 |
| 🔴 | Timeframe overbought / 该周期超买 |
| ⚪ | Timeframe neutral / 该周期中性 |
### Divergence Status / 背离状态
| Emoji | Meaning |
|-------|---------|
| 🟢 BULL DIV | Bullish divergence detected / 检测到看涨背离 |
| 🔴 BEAR DIV | Bearish divergence detected / 检测到看跌背离 |
| — | No divergence / 无背离 |
---
### Alert Emojis / 警报图标
| Emoji | Alert Type | Description |
|-------|------------|-------------|
| 🎯 | Smart Alert | V6 Unified Alert System / V6统一警报系统 |
---
## Overview / 概述
Traditional RSI uses fixed 30/70 thresholds, but different assets have different volatility characteristics.
传统RSI使用固定的30/70阈值,但不同标的有不同的波动特性。
**Solution**: Calculate thresholds using historical percentiles (P5-P95) + advanced features.
**解决方案**:使用历史百分位(P5-P95)计算阈值 + 高级功能。
---
## Features / 功能特性
### 🎯 Adaptive Thresholds / 自适应阈值
- **Z-Score Based Signals**: Uses statistical Z-Score (±2σ for extreme, ±1.5σ for normal) for consistent cross-asset performance
使用统计Z-Score(极端±2σ,普通±1.5σ)实现跨资产一致性
- **Percentile Lines**: Display P5/P10/P25/P50/P75/P90/P95 for visual reference
百分位线(P5-P95)作为视觉参考
- **Dual Display Modes**: Show Z-Score lines, Percentile lines, or both
双重显示模式:可选择显示Z值线、百分位线或两者
### 🔬 Auto-Adaptive Lookback / 自动自适应回看期
- **Statistical Formula**: Uses `n = (Z × σ / E)²` for optimal sample size calculation
统计公式:使用样本量公式自动计算最优回看期
- **Dual Volatility System**: Combines short-term (4× RSI length) and long-term volatility (configurable: 6M/1Y/2Y)
双重波动率系统:结合短期和长期波动率动态调整
- **Precision Control**: Choose High/Normal/Low precision (adjusts acceptable error margin)
精度控制:高/普通/低精度可选(调整统计误差容忍度)
- **Health Indicators**: Real-time validation of sample coverage, distribution spread, and statistical validity
健康度指标:实时验证样本覆盖率、分布宽度和统计有效性
### 📈 Auto-Adaptive Trend Filter / 自动自适应趋势过滤
- **Auto Mode**: Automatically selects optimal filter based on RSI volatility percentiles
自动模式:根据RSI波动率百分位自动选择最优过滤器
- **5 Filter Modes**: Fixed 50, Adaptive P50, SMA(RSI), BB(RSI), or Auto
5种过滤模式:固定50、自适应P50、RSI均线、布林带或自动
- **Smart Selection**: Low volatility → Fixed 50, Medium → Adaptive P50, High → BB(RSI)
智能选择:低波动→固定50,中波动→自适应P50,高波动→布林带
### 🌍 Multi-Timeframe RSI / 多时间框架RSI
- **3 Configurable Timeframes**: View RSI status across multiple timeframes (default: 1h/4h/D)
3个可配置时间框架:跨周期查看RSI状态(默认:1小时/4小时/日线)
- **Auto-Skip Duplicates**: Automatically detects and skips timeframes matching current chart
自动跳过重复:自动检测并跳过与当前图表相同的时间框架
- **Resonance Detection**: Triggers when 3+ valid timeframes agree (oversold/overbought)
共振检测:当3个以上有效时间框架一致时触发强信号
> [!NOTE]
> **MTF Signal Confirmation Timing / 信号确认时机**
>
> - Current timeframe signals update in real-time, confirmed on bar close
> - Higher timeframe signals (e.g., Daily on 1H chart) only update after that timeframe's bar closes
> - **Best Practice**: Wait for current timeframe bar close before acting on MTF resonance signals
>
> - 当前图表周期的信号:实时更新,K线收盘确认
> - 高周期信号(如日线):仅在该周期K线收盘后更新
> - **最佳实践**:MTF共振信号建议在当前周期K线收盘后再做交易决策
### 💎 Auto-Adaptive Divergence Detection / 自动自适应背离检测
- **Auto Mode**: Automatically selects parameters based on asset volatility (using ATR)
自动模式:基于资产波动率(ATR)自动选择参数
- **4 Preset Modes**: Low Vol (3/40), Normal (5/60), High Vol (7/80), Crypto (10/120)
4种预设模式:低波动/普通/高波动/加密货币,分别对应不同的回看/范围参数
- **Extreme Zone Detection**: Distinguishes divergence in extreme zones (💎) vs normal zones (↗️↘️)
极端区域检测:区分极端区域背离(💎)和普通背离(↗️↘️)
- **Bullish/Bearish Divergence**: Price lower low + RSI higher low / Price higher high + RSI lower high
看涨/看跌背离:价格新低+RSI未新低 / 价格新高+RSI未新高
### 📊 Layered Signal Statistics / 分层信号统计
- **4-Tier Classification**: MTF Resonance (🌟) > Divergence+Extreme (💎) > Extreme Only (🔥❄️) > Normal (⬆️⬇️)
四层分级:多周期共振 > 背离+极端 > 仅极端 > 普通信号
- **Independent Tracking**: Each signal tier has separate count, average return, and win rate
独立跟踪:每层信号独立统计次数、平均收益、胜率
- **Signal Cooldown**: Optional cooldown period (default 5 bars) to prevent duplicate counting
信号冷却:可选冷却期(默认5根K线)防止重复计数
- **Real Forward Testing**: Calculates actual returns N bars after signal (configurable 5-100 bars)
真实前瞻测试:计算信号后N根K线的实际收益(可配置5-100)
---
## Z-Score 与 百分位:双重视角 / Dual Perspective
This indicator displays **both Z-Score and Percentile** to provide complementary views of the same RSI distribution.
本指标**同时显示Z-Score和百分位**,为同一RSI分布提供互补视角。
### Why Both? / 为什么同时显示?
**Fundamental Connection / 本质关联**:
两者都是描述RSI在历史分布中位置的统计方法。
Both are statistical methods describing RSI's position in historical distribution.
- **Z-Score(标准分数)**: `(RSI - 均值) / 标准差` - 基于正态分布假设
Based on normal distribution assumption.
- **百分位(Percentile)**: RSI在历史数据中的排名位置 - 不假设分布类型
RSI's ranking position in historical data - no distribution assumption.
**Complementary Advantages / 互补优势**:
| Dimension 维度 | Z-Score | Percentile 百分位 |
|------|---------|------------|
| **Cross-asset Consistency / 跨资产一致性** | ✅ Excellent 优秀 - BTC和SPY都用±2σ | ⚠️ Varies by volatility 因波动率不同而异 |
| **Statistical Rigor / 统计学严谨性** | ✅ Confidence intervals 置信区间、假设检验 | ⚠️ Non-parametric 非参数统计 |
| **Intuitive / 直观易懂** | ⚠️ Stats knowledge needed 需要统计学知识 | ✅ "Below 95% of history" "低于95%历史值" |
| **Use Case / 适用场景** | 📊 Quant backtesting 量化回测、信号触发 | 📈 Visualization 可视化、用户理解 |
### Conversion Reference / 转换对照表
**Quick Reference / 快速对照**(Assuming normal distribution / 假设正态分布):
| Z-Score | Percentile 百分位 | Meaning 含义 | Signal 信号类型 |
|---------|--------|---------------|----------|
| **±2.5σ** | **P0.6 / P99.4** | Extreme anomaly (outside 99% CI) / 极端异常(99%置信区间外) | Rare opportunity 罕见机会 |
| **±2.0σ** | **P2.3 / P97.7** | Extreme OB/OS (outside 95% CI) / 极端超买/超卖(95%置信区间外) | 🔥❄️ Extreme 极端信号 |
| ±1.5σ | P6.7 / P93.3 | Notable deviation / 显著偏离 | ⬆️⬇️ Normal 普通信号(默认) |
| ±1.0σ | P15.9 / P84.1 | Mildly strong/weak / 轻度偏强/偏弱 | — |
| 0σ | P50 | Median / 中位数 | — |
### Dashboard Dual Display / 仪表盘双重显示
**新版Dashboard已实现自动转换**:
```
┌─────────────────────────────────┐
│ ADAPTIVE RSI PRO 28.5 │
├─────────────────────────────────┤
│ Z-Score −2.15σ (≈P2) │ ← Z值 + 近似百分位
│ Percentile P5 (−1.5σ ~ −2σ) │ ← 百分位 + 对应Z值范围
│ Status 🟢 EXTREME OVERSOLD │
└─────────────────────────────────┘
```
**理解方式**:
- **从Z值看**:−2.15σ 表示超过95%置信区间,统计异常 → 对应约P2
- **从百分位看**:P5 表示低于95%历史值,极端超卖 → 对应约−1.5σ到−2σ之间
### Threshold Line Modes / 阈值线模式
**Unified Mode (Recommended) / Unified模式(推荐)** - Balances rigor and intuitiveness / 兼顾严谨性和直观性:
- Draws: Z-Score threshold lines (±2σ, ±1.5σ) / 绘制:Z-Score阈值线(±2σ、±1.5σ)
- Labels: Corresponding percentiles (≈P98, ≈P93, ≈P7, ≈P2) / 标注:对应百分位(≈P98、≈P93、≈P7、≈P2)
- Advantage: Instantly understand statistical meaning and historical position / 优势:一眼看懂统计意义和历史位置
**Other Modes / 其他模式**:
- `Z-Score`: Statistical threshold lines only / 仅显示统计学阈值线
- `Percentile`: Percentile lines only / 仅显示百分位线
- `Both`: Display both types (denser) / 同时显示两类线(较密集)
### Practical Examples / 实际应用示例
**Scenario 1: Identifying Extreme Opportunities / 场景1:识别极端机会**
```
Current RSI / 当前RSI: 25.3
Dashboard shows / Dashboard显示:
Z-Score: −2.35σ (≈P1)
Percentile: P5 (< −2σ)
Status: 🟢 EXTREME OVERSOLD
Interpretation / 解读:
• Statistical perspective / 统计学视角: Beyond 99% confidence interval (|Z| > 2.3) / 超过99%置信区间,极端异常
• Intuitive perspective / 直观视角: Lower than 99% of historical values / 低于99%的历史值都低,罕见超卖
• Conclusion / 结论: Strong buy signal 🔥 / 强力买入信号 🔥
```
**Scenario 2: Normal Signal Judgment / 场景2:普通信号判断**
```
Current RSI / 当前RSI: 63.8
Dashboard shows / Dashboard显示:
Z-Score: +1.52σ (≈P94)
Percentile: P90 (+1.5σ ~ +2σ)
Status: 🟠 OVERBOUGHT
Interpretation / 解读:
• Statistical perspective / 统计学视角: ~1.5 std dev, notably high but not extreme / 约1.5倍标准差,显著偏高但未极端
• Intuitive perspective / 直观视角: Higher than 90% of historical values / 高于90%的历史值,轻度超买
• Conclusion / 结论: Consider reducing position, not forced sell ⬇️ / 考虑减仓,非强制卖出 ⬇️
```
### Dashboard Display Logic / Dashboard显示逻辑
**Z-Score Row Display / Z-Score行显示**:
- Always shows current Z-value (2 decimal places) / 始终显示当前Z值(精确到2位小数)
- Auto-calculates approximate percentile: `≈P[value]` / 自动计算对应的近似百分位:`≈P[数值]`
- Uses Error Function for precise conversion / 使用误差函数(Error Function)精确转换
**Percentile Row Display / Percentile行显示**:
- Shows RSI's percentile range (P5, P10, P25, etc.) / 显示RSI所处的百分位区间(P5, P10, P25等)
- Labels corresponding Z-value range (e.g., `−1.5σ ~ −2σ`) / 标注对应的Z值范围(如:`−1.5σ ~ −2σ`)
- Helps understand what "P10" means statistically / 帮助理解"P10"的统计意义
**Color Association / 颜色关联**:
- Both rows use same status color (green/yellow/white/orange/red) / 两行使用相同的状态颜色(绿/黄/白/橙/红)
- Visually reinforces "same indicator, different expressions" / 视觉上强化"同一指标的不同表达"概念
---
### Dashboard Setups / 仪表盘配置
#### Full Mode (PC/Tablet)
Shows detailed stats, MTF status, and divergence info.
显示详细统计、MTF状态和背离信息。
#### Mobile Mode (Phone) / 手机模式
Simplified 3-row layout optimized for small screens.
极简3行布局,专为手机屏幕优化。
- Row 1: RSI Value / 第1行:RSI数值
- Row 2: Signal Status (Emoji) / 第2行:信号状态 (Emoji)
- Row 3: Trend/Filter Status / 第3行:趋势/过滤状态
### 📈 Dashboard Example / 面板示例
```
┌─────────────────────────────────┐
│ ADAPTIVE RSI PRO 35.2 │
├─────────────────────────────────┤
│ Status 🟢 EXTREME OVERSOLD │
│ Percentile P10 ↓ DOWN │
│ Lookback[Auto] 456 ✅✅✅ │
├─────────────────────────────────├ (Full Mode Only)
│ ── MTF ── │
│ 1h | 4h | D 🟢 | ⚪ | 🟢 │
│ Resonance 🟢 3/4 OVERSOLD │
├─────────────────────────────────┤
│ Divergence[Normal] 🟢 BULL (5/60) │
├─────────────────────────────────┤
│ ── STATS ── (20 bars) │
│ 🌟 MTF Buy(12) +4.2% | 83% │
│ 🌟 MTF Sell(8) +3.8% | 75% │
│ 💎 Div Buy(15) +3.5% | 80% │
│ 💎 Div Sell(11) +2.9% | 73% │
│ 🔥 Ext Buy(45) +2.1% | 67% │
│ ❄️ Ext Sell(38) +1.8% | 63% │
└─────────────────────────────────┘
```
**Health Indicators / 健康度指标**:
- ✅✅✅ = All healthy (所有健康): Sample coverage ≥ 80%, Distribution spread ≥ 15, Statistical validity ≥ 90%
- ⚠️ present = Warning (警告): One or more health checks failed, consider using Custom mode with larger lookback
---
## Chart Lines Guide / 图表线条指南

### 📊 主要线条 / Main Lines
| 线条 | 颜色/样式 | 含义 | 作用 |
|------|----------|------|------|
| **RSI主线** | 黄色粗线 | 当前RSI值 | 实时跟踪相对强弱指标 |
| **P50 自适应中位数** | 白色阶梯线 | 动态中线 | 根据历史数据自动调整的中位数,比固定50更准确 |
### 🔴 超买阈值线 / Overbought Thresholds (上方红色)
| 线条 | Z-Score | 百分位 | 样式 | 信号 |
|------|---------|--------|------|------|
| **极端超买线** | +2σ | ≈P98 | 实线 | 触发 ❄️ 极端超买信号(强卖出) |
| **普通超买线** | +1.5σ | ≈P93 | 圆点虚线 | 触发 ⬇️ 普通超买信号(考虑卖出) |
### 🟢 超卖阈值线 / Oversold Thresholds (下方绿色)
| 线条 | Z-Score | 百分位 | 样式 | 信号 |
|------|---------|--------|------|------|
| **极端超卖线** | -2σ | ≈P2 | 实线 | 触发 🔥 极端超卖信号(强买入) |
| **普通超卖线** | -1.5σ | ≈P7 | 圆点虚线 | 触发 ⬆️ 普通超卖信号(考虑买入) |
### ⚪ 固定参考线 / Fixed Reference Lines
| 线条 | 位置 | 样式 | 作用 |
|------|------|------|------|
| **0线** | 底部 | 灰色点线 | RSI下边界 |
| **50线** | 中间 | 灰色点线 | 传统固定中线参考 |
| **100线** | 顶部 | 灰色点线 | RSI上边界 |
### 🎨 渐变填充区域 / Gradient Fill Zones
- **红色渐变**(上方):超买区域,颜色越深表示越极端
- P95-P90(深红)> P90-P75(中红)> P75-P50(浅红)
- **绿色渐变**(下方):超卖区域,颜色越深表示越极端
- P10-P5(深绿)> P25-P10(中绿)> P50-P25(浅绿)
### 💡 关键要点 / Key Points
**线条样式区分 / Line Style Distinction:**
- **实线** = 极端信号(±2σ),优先级高,统计上95%置信区间外
- **圆点虚线** = 普通信号(±1.5σ),优先级较低,显著偏离但未极端
**动态 vs 固定 / Dynamic vs Fixed:**
- **彩色线**(红/绿)= 根据历史波动动态调整,适应不同资产特性
- **灰色虚线** = 固定不变的参考线,用于传统RSI对比
**视觉层次 / Visual Hierarchy:**
- 线条粗细:RSI主线(最粗)> 极端阈值(粗)> 普通阈值(细)> 参考线(最细)
- 透明度:核心线条(不透明)> 百分位线(半透明)> 填充区(高透明)
---
## Settings / 设置
### RSI Settings / RSI设置
| Setting | Default | Description |
|---------|---------|-------------|
| RSI Length | 14 | RSI calculation period / RSI计算周期 |
| RSI Source | Close | Price source / 价格源 |
### Adaptive Settings / 自适应设置
| Setting | Default | Description |
|---------|---------|-------------|
| Lookback Mode | Auto | Auto (statistical formula) / Custom / 自动/自定义 |
| Custom Lookback | 252 | Only used in Custom mode / 仅自定义模式使用 |
| Precision | Normal | High/Normal/Low: Adjusts error tolerance / 精度等级 |
| History Depth | 1 Year | 6 Months / 1 Year / 2 Years for volatility calculation / 波动率历史深度 |
### Visual Settings / 视觉设置
| Setting | Default | Description |
|---------|---------|-------------|
| Threshold Line Mode | **Unified** | Unified(推荐)/Z-Score/Percentile/Both / 阈值线模式 |
| Show Gradient Fill | ON | Display background gradients / 显示背景渐变 |
| Show Dashboard | ON | Display dashboard panel / 显示仪表盘面板 |
| Dashboard Mode | Full | Full/Lite/Mobile(Phone) / 面板模式 |
| Dashboard Size | Normal | Tiny/Small/Normal/Large / 面板大小 |
| Dashboard Transparency | 30 | 0-100% transparency level / 透明度 |
| Bullish Color | #00E676 | Custom color for bullish signals / 牛市信号颜色 |
| Bearish Color | #FF5252 | Custom color for bearish signals / 熊市信号颜色 |
| RSI Line Color | #FFEB3B | RSI line color / RSI主线颜色 |
### Trend Filter / 趋势过滤
| Setting | Default | Description |
|---------|---------|-------------|
| Enable Trend Filter | OFF | Only trigger signals in trend direction / 趋势方向过滤 |
| Filter Mode | Auto | Auto/Fixed 50/Adaptive P50/SMA(RSI)/BB(RSI) / 过滤模式 |
### Alert Settings / 警报设置
| Setting | Default | Description |
|---------|---------|-------------|
| **🎯 Smart Alert** | **ON** | **V6 Unified Alert System** / V6统一警报系统 |
| Show Normal Signals | OFF | Display ⬆️⬇️ on chart / 图表显示普通信号 |
| Normal Signal Threshold | 1.5σ | Z-Score threshold (1.0-2.0σ) / 普通信号阈值 |
| Enable Signal Cooldown | ON | Prevent duplicate signal counting / 防止重复信号 |
| Cooldown Period | 5 bars | Bars between same signal type / 冷却K线数 |
### Multi-Timeframe / 多时间框架
| Setting | Default | Description |
|---------|---------|-------------|
| Enable | ON | Show MTF analysis / 显示MTF分析 |
| MTF Mode | **Auto** | **Auto** (Fractal Breakdown) / **Manual** (Fixed) / 自动/手动模式 |
| TF1/TF2/TF3 | 60/240/D | Timeframes (Manual mode only) / 时间框架(仅手动模式)|
### Signal Statistics / 信号统计
| Setting | Default | Description |
|---------|---------|-------------|
| Enable | ON | Track performance / 跟踪表现 |
| Forward Bars | 20 | Bars for return calculation / 收益计算K线数 |
### Divergence Detection / 背离检测
| Setting | Default | Description |
|---------|---------|-------------|
| Enable Detection | ON | Detect divergences / 检测背离 |
| Divergence Mode | Auto | Auto/Low Vol/Normal/High Vol/Crypto/Custom / 背离模式 |
| Custom Lookback | 5 | Only in Custom mode / 仅自定义模式使用 |
| Custom Range | 60 | Only in Custom mode / 仅自定义模式使用 |
**Auto Mode Presets / 自动模式预设**:
- Low Vol (蓝筹/ETF): Lookback 3, Range 40
- Normal (一般股票): Lookback 5, Range 60
- High Vol (成长股): Lookback 7, Range 80
- Crypto (加密货币): Lookback 10, Range 120
---
## Alerts / 警报
### 🎯 Smart Alert (V6 Unified System)
**The only alert method / 唯一的警报方式** - 自动聚合所有信号到一条富文本消息
Automatically aggregates all signals into a single rich-text message.
**Setup Steps / 设置方法**:
1. Keep "🎯 Smart Alert" enabled in indicator settings (default) / 指标设置中保持 "🎯 Smart Alert" 开启(默认)
2. When creating alert, select **"Any alert() function call"** / 创建警报时选择 **"Any alert() function call"**
3. Done! You'll receive real-time aggregated alerts / 完成!您会收到实时的聚合警报
**Message Example / 消息示例**:
```
AAPL: 🟢 BUY SIGNALS → 🌟MTF共振 💎背离 🔥极端 | RSI:25.3 Z:-2.1σ (≈P2)
AAPL: 🔴 SELL SIGNALS → ❄️极端 | RSI:78.5 Z:2.3σ (≈P98)
```
**Features / 特性**:
- ✅ **Real-time trigger / 实时触发** - Sends when condition met within bar / K线运行中触发条件即发送
- ✅ **Anti-flicker / 防闪烁** - Uses `varip` to prevent duplicate alerts from signal flickering within same bar / 使用 `varip` 防止信号闪烁导致同一K线内重复警报
- ✅ **Signal upgrade detection / 信号升级检测** - Alerts when stronger signal appears (e.g., 🔥Extreme → 🌟MTF) even on same bar / 同一K线内出现更强信号时也会触发(如:🔥极端 → 🌟MTF共振)
- ✅ **Full context / 完整上下文** - Includes RSI value, Z-Score, approximate percentile / 包含RSI值、Z-Score、近似百分位
- ✅ **Auto-aggregation / 自动聚合** - One message contains all triggered signals / 一条消息包含所有触发的信号
- ✅ **Buy/Sell independent tracking / 买卖独立追踪** - Buy and Sell alerts tracked separately / 买入和卖出警报独立追踪,互不干扰
**Signal Priority Levels / 信号优先级**:
| Level 等级 | Signal 信号 | Description 描述 |
|------------|-------------|------------------|
| 4 (Highest) | 🌟 MTF Resonance | Multi-timeframe agreement / 多周期共振 |
| 3 | 💎 Divergence | Divergence + Extreme zone / 背离+极端区 |
| 2 | 🔥❄️ Extreme | Extreme oversold/overbought / 极端超卖/超买 |
| 1 (Lowest) | ⬆️⬇️ Normal | Normal oversold/overbought / 普通超卖/超买 |
---
## Usage Tips / 使用建议
| Timeframe | Lookback | Use Case |
|-----------|----------|----------|
| Daily | 252 | Swing trading / 波段交易 |
| 4H | 1000 | Short-term / 短线 |
| 1H | 2000 | Day trading / 日内交易 |
**Best Practices / 最佳实践:**
1. Focus on 🌟 and 💎 signals (highest priority) / 优先关注 🌟 和 💎 信号(最高优先级)
2. Use MTF resonance for high-confidence entries / 使用 MTF 共振确认高置信度入场
3. Check win rate in stats before trading / 交易前查看统计胜率
---
## Changelog / 更新日志
### v6.2 - Smart Alert Anti-Flicker / 智能防抖警报 (Current / 当前版本)
- 🛡️ **Anti-flicker Mechanism / 防闪烁机制**: Fixed issue where signal flickering caused multiple duplicate alerts within same bar. Now uses `varip` to track alert status per bar. / 修复信号闪烁导致同一K线内发送多次重复警报的问题,使用 `varip` 追踪每根K线的警报状态。
- 📈 **Signal Upgrade Detection / 信号升级检测**: Tracks signal priority level (MTF=4, Divergence=3, Extreme=2, Normal=1). Sends new alert when stronger signal appears on same bar. / 追踪信号优先级等级。同一K线内出现更强信号时会发送新警报。
- 🔄 **Independent Buy/Sell Tracking / 买卖独立追踪**: Buy and Sell alerts are tracked independently, allowing direction changes within same bar. / 买入和卖出警报独立追踪,允许同一K线内捕捉方向变化。
### v6.1 - Mobile Experience / 移动端体验
- 📱 **Mobile Dashboard / 手机端面板**: Added simplified "Mobile" mode optimized for phone screens (RSI + Signal Emoji only). / 新增简化的"Mobile"模式,针对手机屏幕优化(仅显示RSI+信号Emoji)。
- 🔥 **Persistent Zone Status / 持续区域状态**: Mobile Dashboard now shows persistent extreme zone indicators when no new signal but RSI remains in zone: `🔥持续` (Extreme Oversold), `❄️持续` (Extreme Overbought), `⬆️区` (Oversold), `⬇️区` (Overbought). / 手机端面板现在显示持续极端区域指示器:无新信号但RSI仍在区域内时显示持续状态。
- 🔧 **UX Improvements / 用户体验优化**: Optimized font sizes and layout for small screens. / 优化字体大小和小屏幕布局。
### v6.0 - Alert System Simplification & V6 Optimization / 警报系统简化与V6优化
- 🎯 **Smart Alert System / 智能警报系统简化**:
- **Unified entry / 唯一警报入口**: Removed all legacy alertcondition, unified to V6 Smart Alert / 移除所有legacy alertcondition,统一为V6 Smart Alert
- **Real-time trigger / 实时触发**: Changed to `alert.freq_once_per_bar` for intra-bar response / 改为 `alert.freq_once_per_bar` 实现K线内实时响应
- **Smart dedup / 智能去重**: Rising edge detection (`signal and not signal[1]`) / 上升沿检测,只在新信号出现时触发
- **Auto-aggregation / 自动聚合**: Single message with all signals + RSI + Z-Score + Percentile / 单条消息包含所有触发信号 + RSI + Z-Score + 百分位
- **Simplified settings / 简化设置**: Removed "Extreme Alerts" and "Normal Alerts", only Smart Alert toggle / 移除 "Extreme Alerts" 和 "Normal Alerts",只保留Smart Alert开关
- 🛠 **Performance Optimization / 性能优化**:
- Reduced `request.security` calls by 50% using Tuple Requests / 使用元组请求减少50%的`request.security`调用
- Implemented `str.format()` for cleaner and faster string processing / 实现`str.format()`使字符串处理更简洁高效
- 🧹 **Code Cleanup / 代码清理**:
- Refactored timeframe display and alert logic / 重构时间框架显示和警报逻辑
- Fixed plot limit issues and tuple assignment syntax / 修复绑点限制问题和元组赋值语法
- Unified plot titles with percentile annotations / 统一绑点标题与百分位标注
### v5.0 - Adaptive Fractal MTF / 自适应分形MTF
- 🧠 **Adaptive Fractal MTF / 自适应分形MTF**: New "Auto" mode automatically selects lower timeframes for precision structure analysis (Internal Fractal Resonance). / 新增"Auto"模式,自动选择更低时间框架进行精确结构分析(内部分形共振)。
- Daily Chart → Analyzes 1H & 4H / 日线图 → 分析1小时和4小时
- 1H Chart → Analyzes 5m & 15m / 1小时图 → 分析5分钟和15分钟
- 15m Chart → Analyzes 1m & 5m / 15分钟图 → 分析1分钟和5分钟
- 🛠 **Code Refactoring / 代码重构**: Implemented Pine Script v6 UDTs (Objects) and Methods for robust signal statistics. / 实现Pine Script v6 UDT(对象)和方法,增强信号统计的健壮性。
- 🎨 **Dashboard Optimization / 面板优化**: Enhanced string formatting using `str.format` for cleaner display. / 使用`str.format`优化字符串格式,显示更简洁。
### v4.0 - Pine Script v6 Upgrade / Pine Script v6升级
- 🚀 Upgraded entire codebase to **Pine Script v6** engine / 将整个代码库升级到 **Pine Script v6** 引擎
- ⚡ Optimization for better performance and future-proofing / 性能优化,面向未来
- 🛠 Maintenance updates for latest TradingView standards / 维护更新以符合最新TradingView标准
### v3.0 - Auto-Adaptive Systems / 自动自适应系统
- ✨ Auto-adaptive lookback using formula `n = (Z × σ / E)²` / 使用统计公式 `n = (Z × σ / E)²` 自动计算回看期
- ✨ Auto-adaptive trend filter with 5 modes / 5种模式的自动自适应趋势过滤器
- ✨ Auto-adaptive divergence detection with 4 presets / 4种预设的自动自适应背离检测
- ✨ Layered statistics (MTF/Divergence/Extreme/Normal) / 分层统计系统(MTF/背离/极端/普通)
- ✨ Signal cooldown to prevent duplicate counting / 信号冷却机制防止重复计数
- ✨ Health indicators for lookback validation / 回看期健康度指标验证
- ✨ Dashboard modes (Lite/Full) with customization / 面板模式(Lite/Full)支持自定义大小和透明度
- ✨ Dual volatility system (short + long-term) / 双重波动率系统(短期+长期)
### v2.1 - Signal Optimization / 信号优化
- ✨ Consolidated signals with priority system / 信号合并与优先级系统(无重叠)
- ✨ Emoji-based signal display / 基于Emoji的信号显示
- ✨ MTF timeframe auto-skip for duplicates / MTF时间框架自动跳过重复
### v2.0 - Pro Edition / 专业版
- ✨ Added Trend Filter, MTF RSI, Statistics, Divergence / 新增趋势过滤、MTF RSI、统计、背离检测
- ✨ Z-Score based signal triggering / 基于Z-Score的信号触发
### v1.0 - Initial Release / 初始发布
- ✨ Adaptive percentile-based thresholds / 自适应百分位阈值
---
## License
MIT License - Feel free to use, modify, and share.
[](https://www.tradingview.com/scripts/)
[](https://www.tradingview.com/pine-script-reference/v6/)
[](https://opensource.org/licenses/MIT)
Dynamic overbought/oversold thresholds + Multi-Timeframe analysis + Divergence detection + Signal statistics.
根据每个标的实际历史分布动态计算超买/超卖阈值,结合多时间框架分析、背离检测和信号统计。
**Pine Script v6** | **Last Update: 2025-12-17** | **v6.2**
---
## Emoji Legend / 信号图例
### Chart Signals / 图表信号
#### Buy Signals / 买入信号 (底部显示)
| Emoji | Signal Name | Condition | Priority | Action |
|-------|-------------|-----------|----------|--------|
| 🌟 | MTF + Extreme | 3+ timeframes oversold + Z<−2σ | ★★★★★ | **STRONG BUY** 强力买入 |
| 💎 | Divergence + Extreme | Bullish divergence in Z<−2σ zone | ★★★★☆ | **BUY** 买入 |
| 🔥 | Extreme Oversold | Z-Score crosses below −2σ (≈P2) | ★★★☆☆ | **BUY** 买入 |
| ⬆️ | Normal Oversold | Z-Score crosses below −1.5σ (≈P7) | ★★☆☆☆ | Consider buy 考虑买入 (默认隐藏) |
| ↗️ | Bullish Divergence | Price↓ RSI↑ (not in extreme zone) | ★☆☆☆☆ | Watch 观察 (潜在底部) |
#### Sell Signals / 卖出信号 (顶部显示)
| Emoji | Signal Name | Condition | Priority | Action |
|-------|-------------|-----------|----------|--------|
| 🌟 | MTF + Extreme | 3+ timeframes overbought + Z>+2σ | ★★★★★ | **STRONG SELL** 强力卖出 |
| 💎 | Divergence + Extreme | Bearish divergence in Z>+2σ zone | ★★★★☆ | **SELL** 卖出 |
| ❄️ | Extreme Overbought | Z-Score crosses above +2σ (≈P98) | ★★★☆☆ | **SELL** 卖出 |
| ⬇️ | Normal Overbought | Z-Score crosses above +1.5σ (≈P93) | ★★☆☆☆ | Consider sell 考虑卖出 (默认隐藏) |
| ↘️ | Bearish Divergence | Price↑ RSI↓ (not in extreme zone) | ★☆☆☆☆ | Watch 观察 (潜在顶部) |
> **Priority System / 优先级系统**: Only the highest priority signal is shown to prevent overlapping.
> 只显示最高优先级信号,避免叠加。
---
### Dashboard Status / 仪表盘状态
| Emoji | Status | Meaning |
|-------|--------|---------|
| 🟢 | EXTREME OVERSOLD | Z-Score < −2σ (≈P2.3), strong buy zone / 极端超卖区,强买区 |
| 🟡 | OVERSOLD | Z-Score < −1.5σ (≈P6.7), oversold / 超卖 |
| ⚪ | NEUTRAL | −1.5σ ≤ Z-Score ≤ +1.5σ, no signal / 中性,无信号 |
| 🟠 | OVERBOUGHT | Z-Score > +1.5σ (≈P93.3), overbought / 超买 |
| 🔴 | EXTREME OVERBOUGHT | Z-Score > +2σ (≈P97.7), strong sell zone / 极端超买区,强卖区 |
### MTF Status / 多周期状态
| Emoji | Meaning |
|-------|---------|
| 🟢 | Timeframe oversold / 该周期超卖 |
| 🔴 | Timeframe overbought / 该周期超买 |
| ⚪ | Timeframe neutral / 该周期中性 |
### Divergence Status / 背离状态
| Emoji | Meaning |
|-------|---------|
| 🟢 BULL DIV | Bullish divergence detected / 检测到看涨背离 |
| 🔴 BEAR DIV | Bearish divergence detected / 检测到看跌背离 |
| — | No divergence / 无背离 |
---
### Alert Emojis / 警报图标
| Emoji | Alert Type | Description |
|-------|------------|-------------|
| 🎯 | Smart Alert | V6 Unified Alert System / V6统一警报系统 |
---
## Overview / 概述
Traditional RSI uses fixed 30/70 thresholds, but different assets have different volatility characteristics.
传统RSI使用固定的30/70阈值,但不同标的有不同的波动特性。
**Solution**: Calculate thresholds using historical percentiles (P5-P95) + advanced features.
**解决方案**:使用历史百分位(P5-P95)计算阈值 + 高级功能。
---
## Features / 功能特性
### 🎯 Adaptive Thresholds / 自适应阈值
- **Z-Score Based Signals**: Uses statistical Z-Score (±2σ for extreme, ±1.5σ for normal) for consistent cross-asset performance
使用统计Z-Score(极端±2σ,普通±1.5σ)实现跨资产一致性
- **Percentile Lines**: Display P5/P10/P25/P50/P75/P90/P95 for visual reference
百分位线(P5-P95)作为视觉参考
- **Dual Display Modes**: Show Z-Score lines, Percentile lines, or both
双重显示模式:可选择显示Z值线、百分位线或两者
### 🔬 Auto-Adaptive Lookback / 自动自适应回看期
- **Statistical Formula**: Uses `n = (Z × σ / E)²` for optimal sample size calculation
统计公式:使用样本量公式自动计算最优回看期
- **Dual Volatility System**: Combines short-term (4× RSI length) and long-term volatility (configurable: 6M/1Y/2Y)
双重波动率系统:结合短期和长期波动率动态调整
- **Precision Control**: Choose High/Normal/Low precision (adjusts acceptable error margin)
精度控制:高/普通/低精度可选(调整统计误差容忍度)
- **Health Indicators**: Real-time validation of sample coverage, distribution spread, and statistical validity
健康度指标:实时验证样本覆盖率、分布宽度和统计有效性
### 📈 Auto-Adaptive Trend Filter / 自动自适应趋势过滤
- **Auto Mode**: Automatically selects optimal filter based on RSI volatility percentiles
自动模式:根据RSI波动率百分位自动选择最优过滤器
- **5 Filter Modes**: Fixed 50, Adaptive P50, SMA(RSI), BB(RSI), or Auto
5种过滤模式:固定50、自适应P50、RSI均线、布林带或自动
- **Smart Selection**: Low volatility → Fixed 50, Medium → Adaptive P50, High → BB(RSI)
智能选择:低波动→固定50,中波动→自适应P50,高波动→布林带
### 🌍 Multi-Timeframe RSI / 多时间框架RSI
- **3 Configurable Timeframes**: View RSI status across multiple timeframes (default: 1h/4h/D)
3个可配置时间框架:跨周期查看RSI状态(默认:1小时/4小时/日线)
- **Auto-Skip Duplicates**: Automatically detects and skips timeframes matching current chart
自动跳过重复:自动检测并跳过与当前图表相同的时间框架
- **Resonance Detection**: Triggers when 3+ valid timeframes agree (oversold/overbought)
共振检测:当3个以上有效时间框架一致时触发强信号
> [!NOTE]
> **MTF Signal Confirmation Timing / 信号确认时机**
>
> - Current timeframe signals update in real-time, confirmed on bar close
> - Higher timeframe signals (e.g., Daily on 1H chart) only update after that timeframe's bar closes
> - **Best Practice**: Wait for current timeframe bar close before acting on MTF resonance signals
>
> - 当前图表周期的信号:实时更新,K线收盘确认
> - 高周期信号(如日线):仅在该周期K线收盘后更新
> - **最佳实践**:MTF共振信号建议在当前周期K线收盘后再做交易决策
### 💎 Auto-Adaptive Divergence Detection / 自动自适应背离检测
- **Auto Mode**: Automatically selects parameters based on asset volatility (using ATR)
自动模式:基于资产波动率(ATR)自动选择参数
- **4 Preset Modes**: Low Vol (3/40), Normal (5/60), High Vol (7/80), Crypto (10/120)
4种预设模式:低波动/普通/高波动/加密货币,分别对应不同的回看/范围参数
- **Extreme Zone Detection**: Distinguishes divergence in extreme zones (💎) vs normal zones (↗️↘️)
极端区域检测:区分极端区域背离(💎)和普通背离(↗️↘️)
- **Bullish/Bearish Divergence**: Price lower low + RSI higher low / Price higher high + RSI lower high
看涨/看跌背离:价格新低+RSI未新低 / 价格新高+RSI未新高
### 📊 Layered Signal Statistics / 分层信号统计
- **4-Tier Classification**: MTF Resonance (🌟) > Divergence+Extreme (💎) > Extreme Only (🔥❄️) > Normal (⬆️⬇️)
四层分级:多周期共振 > 背离+极端 > 仅极端 > 普通信号
- **Independent Tracking**: Each signal tier has separate count, average return, and win rate
独立跟踪:每层信号独立统计次数、平均收益、胜率
- **Signal Cooldown**: Optional cooldown period (default 5 bars) to prevent duplicate counting
信号冷却:可选冷却期(默认5根K线)防止重复计数
- **Real Forward Testing**: Calculates actual returns N bars after signal (configurable 5-100 bars)
真实前瞻测试:计算信号后N根K线的实际收益(可配置5-100)
---
## Z-Score 与 百分位:双重视角 / Dual Perspective
This indicator displays **both Z-Score and Percentile** to provide complementary views of the same RSI distribution.
本指标**同时显示Z-Score和百分位**,为同一RSI分布提供互补视角。
### Why Both? / 为什么同时显示?
**Fundamental Connection / 本质关联**:
两者都是描述RSI在历史分布中位置的统计方法。
Both are statistical methods describing RSI's position in historical distribution.
- **Z-Score(标准分数)**: `(RSI - 均值) / 标准差` - 基于正态分布假设
Based on normal distribution assumption.
- **百分位(Percentile)**: RSI在历史数据中的排名位置 - 不假设分布类型
RSI's ranking position in historical data - no distribution assumption.
**Complementary Advantages / 互补优势**:
| Dimension 维度 | Z-Score | Percentile 百分位 |
|------|---------|------------|
| **Cross-asset Consistency / 跨资产一致性** | ✅ Excellent 优秀 - BTC和SPY都用±2σ | ⚠️ Varies by volatility 因波动率不同而异 |
| **Statistical Rigor / 统计学严谨性** | ✅ Confidence intervals 置信区间、假设检验 | ⚠️ Non-parametric 非参数统计 |
| **Intuitive / 直观易懂** | ⚠️ Stats knowledge needed 需要统计学知识 | ✅ "Below 95% of history" "低于95%历史值" |
| **Use Case / 适用场景** | 📊 Quant backtesting 量化回测、信号触发 | 📈 Visualization 可视化、用户理解 |
### Conversion Reference / 转换对照表
**Quick Reference / 快速对照**(Assuming normal distribution / 假设正态分布):
| Z-Score | Percentile 百分位 | Meaning 含义 | Signal 信号类型 |
|---------|--------|---------------|----------|
| **±2.5σ** | **P0.6 / P99.4** | Extreme anomaly (outside 99% CI) / 极端异常(99%置信区间外) | Rare opportunity 罕见机会 |
| **±2.0σ** | **P2.3 / P97.7** | Extreme OB/OS (outside 95% CI) / 极端超买/超卖(95%置信区间外) | 🔥❄️ Extreme 极端信号 |
| ±1.5σ | P6.7 / P93.3 | Notable deviation / 显著偏离 | ⬆️⬇️ Normal 普通信号(默认) |
| ±1.0σ | P15.9 / P84.1 | Mildly strong/weak / 轻度偏强/偏弱 | — |
| 0σ | P50 | Median / 中位数 | — |
### Dashboard Dual Display / 仪表盘双重显示
**新版Dashboard已实现自动转换**:
```
┌─────────────────────────────────┐
│ ADAPTIVE RSI PRO 28.5 │
├─────────────────────────────────┤
│ Z-Score −2.15σ (≈P2) │ ← Z值 + 近似百分位
│ Percentile P5 (−1.5σ ~ −2σ) │ ← 百分位 + 对应Z值范围
│ Status 🟢 EXTREME OVERSOLD │
└─────────────────────────────────┘
```
**理解方式**:
- **从Z值看**:−2.15σ 表示超过95%置信区间,统计异常 → 对应约P2
- **从百分位看**:P5 表示低于95%历史值,极端超卖 → 对应约−1.5σ到−2σ之间
### Threshold Line Modes / 阈值线模式
**Unified Mode (Recommended) / Unified模式(推荐)** - Balances rigor and intuitiveness / 兼顾严谨性和直观性:
- Draws: Z-Score threshold lines (±2σ, ±1.5σ) / 绘制:Z-Score阈值线(±2σ、±1.5σ)
- Labels: Corresponding percentiles (≈P98, ≈P93, ≈P7, ≈P2) / 标注:对应百分位(≈P98、≈P93、≈P7、≈P2)
- Advantage: Instantly understand statistical meaning and historical position / 优势:一眼看懂统计意义和历史位置
**Other Modes / 其他模式**:
- `Z-Score`: Statistical threshold lines only / 仅显示统计学阈值线
- `Percentile`: Percentile lines only / 仅显示百分位线
- `Both`: Display both types (denser) / 同时显示两类线(较密集)
### Practical Examples / 实际应用示例
**Scenario 1: Identifying Extreme Opportunities / 场景1:识别极端机会**
```
Current RSI / 当前RSI: 25.3
Dashboard shows / Dashboard显示:
Z-Score: −2.35σ (≈P1)
Percentile: P5 (< −2σ)
Status: 🟢 EXTREME OVERSOLD
Interpretation / 解读:
• Statistical perspective / 统计学视角: Beyond 99% confidence interval (|Z| > 2.3) / 超过99%置信区间,极端异常
• Intuitive perspective / 直观视角: Lower than 99% of historical values / 低于99%的历史值都低,罕见超卖
• Conclusion / 结论: Strong buy signal 🔥 / 强力买入信号 🔥
```
**Scenario 2: Normal Signal Judgment / 场景2:普通信号判断**
```
Current RSI / 当前RSI: 63.8
Dashboard shows / Dashboard显示:
Z-Score: +1.52σ (≈P94)
Percentile: P90 (+1.5σ ~ +2σ)
Status: 🟠 OVERBOUGHT
Interpretation / 解读:
• Statistical perspective / 统计学视角: ~1.5 std dev, notably high but not extreme / 约1.5倍标准差,显著偏高但未极端
• Intuitive perspective / 直观视角: Higher than 90% of historical values / 高于90%的历史值,轻度超买
• Conclusion / 结论: Consider reducing position, not forced sell ⬇️ / 考虑减仓,非强制卖出 ⬇️
```
### Dashboard Display Logic / Dashboard显示逻辑
**Z-Score Row Display / Z-Score行显示**:
- Always shows current Z-value (2 decimal places) / 始终显示当前Z值(精确到2位小数)
- Auto-calculates approximate percentile: `≈P[value]` / 自动计算对应的近似百分位:`≈P[数值]`
- Uses Error Function for precise conversion / 使用误差函数(Error Function)精确转换
**Percentile Row Display / Percentile行显示**:
- Shows RSI's percentile range (P5, P10, P25, etc.) / 显示RSI所处的百分位区间(P5, P10, P25等)
- Labels corresponding Z-value range (e.g., `−1.5σ ~ −2σ`) / 标注对应的Z值范围(如:`−1.5σ ~ −2σ`)
- Helps understand what "P10" means statistically / 帮助理解"P10"的统计意义
**Color Association / 颜色关联**:
- Both rows use same status color (green/yellow/white/orange/red) / 两行使用相同的状态颜色(绿/黄/白/橙/红)
- Visually reinforces "same indicator, different expressions" / 视觉上强化"同一指标的不同表达"概念
---
### Dashboard Setups / 仪表盘配置
#### Full Mode (PC/Tablet)
Shows detailed stats, MTF status, and divergence info.
显示详细统计、MTF状态和背离信息。
#### Mobile Mode (Phone) / 手机模式
Simplified 3-row layout optimized for small screens.
极简3行布局,专为手机屏幕优化。
- Row 1: RSI Value / 第1行:RSI数值
- Row 2: Signal Status (Emoji) / 第2行:信号状态 (Emoji)
- Row 3: Trend/Filter Status / 第3行:趋势/过滤状态
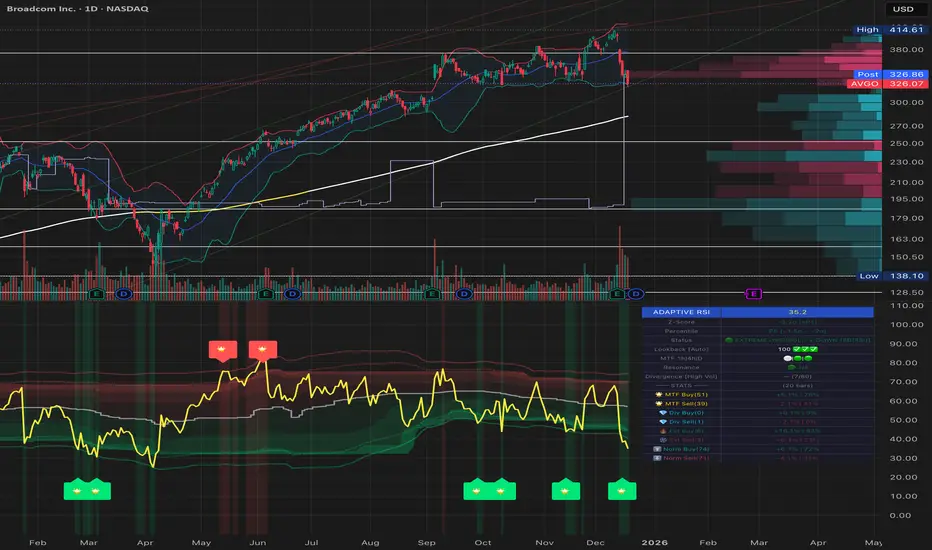
### 📈 Dashboard Example / 面板示例
```
┌─────────────────────────────────┐
│ ADAPTIVE RSI PRO 35.2 │
├─────────────────────────────────┤
│ Status 🟢 EXTREME OVERSOLD │
│ Percentile P10 ↓ DOWN │
│ Lookback[Auto] 456 ✅✅✅ │
├─────────────────────────────────├ (Full Mode Only)
│ ── MTF ── │
│ 1h | 4h | D 🟢 | ⚪ | 🟢 │
│ Resonance 🟢 3/4 OVERSOLD │
├─────────────────────────────────┤
│ Divergence[Normal] 🟢 BULL (5/60) │
├─────────────────────────────────┤
│ ── STATS ── (20 bars) │
│ 🌟 MTF Buy(12) +4.2% | 83% │
│ 🌟 MTF Sell(8) +3.8% | 75% │
│ 💎 Div Buy(15) +3.5% | 80% │
│ 💎 Div Sell(11) +2.9% | 73% │
│ 🔥 Ext Buy(45) +2.1% | 67% │
│ ❄️ Ext Sell(38) +1.8% | 63% │
└─────────────────────────────────┘
```
**Health Indicators / 健康度指标**:
- ✅✅✅ = All healthy (所有健康): Sample coverage ≥ 80%, Distribution spread ≥ 15, Statistical validity ≥ 90%
- ⚠️ present = Warning (警告): One or more health checks failed, consider using Custom mode with larger lookback
---
## Chart Lines Guide / 图表线条指南

### 📊 主要线条 / Main Lines
| 线条 | 颜色/样式 | 含义 | 作用 |
|------|----------|------|------|
| **RSI主线** | 黄色粗线 | 当前RSI值 | 实时跟踪相对强弱指标 |
| **P50 自适应中位数** | 白色阶梯线 | 动态中线 | 根据历史数据自动调整的中位数,比固定50更准确 |
### 🔴 超买阈值线 / Overbought Thresholds (上方红色)
| 线条 | Z-Score | 百分位 | 样式 | 信号 |
|------|---------|--------|------|------|
| **极端超买线** | +2σ | ≈P98 | 实线 | 触发 ❄️ 极端超买信号(强卖出) |
| **普通超买线** | +1.5σ | ≈P93 | 圆点虚线 | 触发 ⬇️ 普通超买信号(考虑卖出) |
### 🟢 超卖阈值线 / Oversold Thresholds (下方绿色)
| 线条 | Z-Score | 百分位 | 样式 | 信号 |
|------|---------|--------|------|------|
| **极端超卖线** | -2σ | ≈P2 | 实线 | 触发 🔥 极端超卖信号(强买入) |
| **普通超卖线** | -1.5σ | ≈P7 | 圆点虚线 | 触发 ⬆️ 普通超卖信号(考虑买入) |
### ⚪ 固定参考线 / Fixed Reference Lines
| 线条 | 位置 | 样式 | 作用 |
|------|------|------|------|
| **0线** | 底部 | 灰色点线 | RSI下边界 |
| **50线** | 中间 | 灰色点线 | 传统固定中线参考 |
| **100线** | 顶部 | 灰色点线 | RSI上边界 |
### 🎨 渐变填充区域 / Gradient Fill Zones
- **红色渐变**(上方):超买区域,颜色越深表示越极端
- P95-P90(深红)> P90-P75(中红)> P75-P50(浅红)
- **绿色渐变**(下方):超卖区域,颜色越深表示越极端
- P10-P5(深绿)> P25-P10(中绿)> P50-P25(浅绿)
### 💡 关键要点 / Key Points
**线条样式区分 / Line Style Distinction:**
- **实线** = 极端信号(±2σ),优先级高,统计上95%置信区间外
- **圆点虚线** = 普通信号(±1.5σ),优先级较低,显著偏离但未极端
**动态 vs 固定 / Dynamic vs Fixed:**
- **彩色线**(红/绿)= 根据历史波动动态调整,适应不同资产特性
- **灰色虚线** = 固定不变的参考线,用于传统RSI对比
**视觉层次 / Visual Hierarchy:**
- 线条粗细:RSI主线(最粗)> 极端阈值(粗)> 普通阈值(细)> 参考线(最细)
- 透明度:核心线条(不透明)> 百分位线(半透明)> 填充区(高透明)
---
## Settings / 设置
### RSI Settings / RSI设置
| Setting | Default | Description |
|---------|---------|-------------|
| RSI Length | 14 | RSI calculation period / RSI计算周期 |
| RSI Source | Close | Price source / 价格源 |
### Adaptive Settings / 自适应设置
| Setting | Default | Description |
|---------|---------|-------------|
| Lookback Mode | Auto | Auto (statistical formula) / Custom / 自动/自定义 |
| Custom Lookback | 252 | Only used in Custom mode / 仅自定义模式使用 |
| Precision | Normal | High/Normal/Low: Adjusts error tolerance / 精度等级 |
| History Depth | 1 Year | 6 Months / 1 Year / 2 Years for volatility calculation / 波动率历史深度 |
### Visual Settings / 视觉设置
| Setting | Default | Description |
|---------|---------|-------------|
| Threshold Line Mode | **Unified** | Unified(推荐)/Z-Score/Percentile/Both / 阈值线模式 |
| Show Gradient Fill | ON | Display background gradients / 显示背景渐变 |
| Show Dashboard | ON | Display dashboard panel / 显示仪表盘面板 |
| Dashboard Mode | Full | Full/Lite/Mobile(Phone) / 面板模式 |
| Dashboard Size | Normal | Tiny/Small/Normal/Large / 面板大小 |
| Dashboard Transparency | 30 | 0-100% transparency level / 透明度 |
| Bullish Color | #00E676 | Custom color for bullish signals / 牛市信号颜色 |
| Bearish Color | #FF5252 | Custom color for bearish signals / 熊市信号颜色 |
| RSI Line Color | #FFEB3B | RSI line color / RSI主线颜色 |
### Trend Filter / 趋势过滤
| Setting | Default | Description |
|---------|---------|-------------|
| Enable Trend Filter | OFF | Only trigger signals in trend direction / 趋势方向过滤 |
| Filter Mode | Auto | Auto/Fixed 50/Adaptive P50/SMA(RSI)/BB(RSI) / 过滤模式 |
### Alert Settings / 警报设置
| Setting | Default | Description |
|---------|---------|-------------|
| **🎯 Smart Alert** | **ON** | **V6 Unified Alert System** / V6统一警报系统 |
| Show Normal Signals | OFF | Display ⬆️⬇️ on chart / 图表显示普通信号 |
| Normal Signal Threshold | 1.5σ | Z-Score threshold (1.0-2.0σ) / 普通信号阈值 |
| Enable Signal Cooldown | ON | Prevent duplicate signal counting / 防止重复信号 |
| Cooldown Period | 5 bars | Bars between same signal type / 冷却K线数 |
### Multi-Timeframe / 多时间框架
| Setting | Default | Description |
|---------|---------|-------------|
| Enable | ON | Show MTF analysis / 显示MTF分析 |
| MTF Mode | **Auto** | **Auto** (Fractal Breakdown) / **Manual** (Fixed) / 自动/手动模式 |
| TF1/TF2/TF3 | 60/240/D | Timeframes (Manual mode only) / 时间框架(仅手动模式)|
### Signal Statistics / 信号统计
| Setting | Default | Description |
|---------|---------|-------------|
| Enable | ON | Track performance / 跟踪表现 |
| Forward Bars | 20 | Bars for return calculation / 收益计算K线数 |
### Divergence Detection / 背离检测
| Setting | Default | Description |
|---------|---------|-------------|
| Enable Detection | ON | Detect divergences / 检测背离 |
| Divergence Mode | Auto | Auto/Low Vol/Normal/High Vol/Crypto/Custom / 背离模式 |
| Custom Lookback | 5 | Only in Custom mode / 仅自定义模式使用 |
| Custom Range | 60 | Only in Custom mode / 仅自定义模式使用 |
**Auto Mode Presets / 自动模式预设**:
- Low Vol (蓝筹/ETF): Lookback 3, Range 40
- Normal (一般股票): Lookback 5, Range 60
- High Vol (成长股): Lookback 7, Range 80
- Crypto (加密货币): Lookback 10, Range 120
---
## Alerts / 警报
### 🎯 Smart Alert (V6 Unified System)
**The only alert method / 唯一的警报方式** - 自动聚合所有信号到一条富文本消息
Automatically aggregates all signals into a single rich-text message.
**Setup Steps / 设置方法**:
1. Keep "🎯 Smart Alert" enabled in indicator settings (default) / 指标设置中保持 "🎯 Smart Alert" 开启(默认)
2. When creating alert, select **"Any alert() function call"** / 创建警报时选择 **"Any alert() function call"**
3. Done! You'll receive real-time aggregated alerts / 完成!您会收到实时的聚合警报
**Message Example / 消息示例**:
```
AAPL: 🟢 BUY SIGNALS → 🌟MTF共振 💎背离 🔥极端 | RSI:25.3 Z:-2.1σ (≈P2)
AAPL: 🔴 SELL SIGNALS → ❄️极端 | RSI:78.5 Z:2.3σ (≈P98)
```
**Features / 特性**:
- ✅ **Real-time trigger / 实时触发** - Sends when condition met within bar / K线运行中触发条件即发送
- ✅ **Anti-flicker / 防闪烁** - Uses `varip` to prevent duplicate alerts from signal flickering within same bar / 使用 `varip` 防止信号闪烁导致同一K线内重复警报
- ✅ **Signal upgrade detection / 信号升级检测** - Alerts when stronger signal appears (e.g., 🔥Extreme → 🌟MTF) even on same bar / 同一K线内出现更强信号时也会触发(如:🔥极端 → 🌟MTF共振)
- ✅ **Full context / 完整上下文** - Includes RSI value, Z-Score, approximate percentile / 包含RSI值、Z-Score、近似百分位
- ✅ **Auto-aggregation / 自动聚合** - One message contains all triggered signals / 一条消息包含所有触发的信号
- ✅ **Buy/Sell independent tracking / 买卖独立追踪** - Buy and Sell alerts tracked separately / 买入和卖出警报独立追踪,互不干扰
**Signal Priority Levels / 信号优先级**:
| Level 等级 | Signal 信号 | Description 描述 |
|------------|-------------|------------------|
| 4 (Highest) | 🌟 MTF Resonance | Multi-timeframe agreement / 多周期共振 |
| 3 | 💎 Divergence | Divergence + Extreme zone / 背离+极端区 |
| 2 | 🔥❄️ Extreme | Extreme oversold/overbought / 极端超卖/超买 |
| 1 (Lowest) | ⬆️⬇️ Normal | Normal oversold/overbought / 普通超卖/超买 |
---
## Usage Tips / 使用建议
| Timeframe | Lookback | Use Case |
|-----------|----------|----------|
| Daily | 252 | Swing trading / 波段交易 |
| 4H | 1000 | Short-term / 短线 |
| 1H | 2000 | Day trading / 日内交易 |
**Best Practices / 最佳实践:**
1. Focus on 🌟 and 💎 signals (highest priority) / 优先关注 🌟 和 💎 信号(最高优先级)
2. Use MTF resonance for high-confidence entries / 使用 MTF 共振确认高置信度入场
3. Check win rate in stats before trading / 交易前查看统计胜率
---
## Changelog / 更新日志
### v6.2 - Smart Alert Anti-Flicker / 智能防抖警报 (Current / 当前版本)
- 🛡️ **Anti-flicker Mechanism / 防闪烁机制**: Fixed issue where signal flickering caused multiple duplicate alerts within same bar. Now uses `varip` to track alert status per bar. / 修复信号闪烁导致同一K线内发送多次重复警报的问题,使用 `varip` 追踪每根K线的警报状态。
- 📈 **Signal Upgrade Detection / 信号升级检测**: Tracks signal priority level (MTF=4, Divergence=3, Extreme=2, Normal=1). Sends new alert when stronger signal appears on same bar. / 追踪信号优先级等级。同一K线内出现更强信号时会发送新警报。
- 🔄 **Independent Buy/Sell Tracking / 买卖独立追踪**: Buy and Sell alerts are tracked independently, allowing direction changes within same bar. / 买入和卖出警报独立追踪,允许同一K线内捕捉方向变化。
### v6.1 - Mobile Experience / 移动端体验
- 📱 **Mobile Dashboard / 手机端面板**: Added simplified "Mobile" mode optimized for phone screens (RSI + Signal Emoji only). / 新增简化的"Mobile"模式,针对手机屏幕优化(仅显示RSI+信号Emoji)。
- 🔥 **Persistent Zone Status / 持续区域状态**: Mobile Dashboard now shows persistent extreme zone indicators when no new signal but RSI remains in zone: `🔥持续` (Extreme Oversold), `❄️持续` (Extreme Overbought), `⬆️区` (Oversold), `⬇️区` (Overbought). / 手机端面板现在显示持续极端区域指示器:无新信号但RSI仍在区域内时显示持续状态。
- 🔧 **UX Improvements / 用户体验优化**: Optimized font sizes and layout for small screens. / 优化字体大小和小屏幕布局。
### v6.0 - Alert System Simplification & V6 Optimization / 警报系统简化与V6优化
- 🎯 **Smart Alert System / 智能警报系统简化**:
- **Unified entry / 唯一警报入口**: Removed all legacy alertcondition, unified to V6 Smart Alert / 移除所有legacy alertcondition,统一为V6 Smart Alert
- **Real-time trigger / 实时触发**: Changed to `alert.freq_once_per_bar` for intra-bar response / 改为 `alert.freq_once_per_bar` 实现K线内实时响应
- **Smart dedup / 智能去重**: Rising edge detection (`signal and not signal[1]`) / 上升沿检测,只在新信号出现时触发
- **Auto-aggregation / 自动聚合**: Single message with all signals + RSI + Z-Score + Percentile / 单条消息包含所有触发信号 + RSI + Z-Score + 百分位
- **Simplified settings / 简化设置**: Removed "Extreme Alerts" and "Normal Alerts", only Smart Alert toggle / 移除 "Extreme Alerts" 和 "Normal Alerts",只保留Smart Alert开关
- 🛠 **Performance Optimization / 性能优化**:
- Reduced `request.security` calls by 50% using Tuple Requests / 使用元组请求减少50%的`request.security`调用
- Implemented `str.format()` for cleaner and faster string processing / 实现`str.format()`使字符串处理更简洁高效
- 🧹 **Code Cleanup / 代码清理**:
- Refactored timeframe display and alert logic / 重构时间框架显示和警报逻辑
- Fixed plot limit issues and tuple assignment syntax / 修复绑点限制问题和元组赋值语法
- Unified plot titles with percentile annotations / 统一绑点标题与百分位标注
### v5.0 - Adaptive Fractal MTF / 自适应分形MTF
- 🧠 **Adaptive Fractal MTF / 自适应分形MTF**: New "Auto" mode automatically selects lower timeframes for precision structure analysis (Internal Fractal Resonance). / 新增"Auto"模式,自动选择更低时间框架进行精确结构分析(内部分形共振)。
- Daily Chart → Analyzes 1H & 4H / 日线图 → 分析1小时和4小时
- 1H Chart → Analyzes 5m & 15m / 1小时图 → 分析5分钟和15分钟
- 15m Chart → Analyzes 1m & 5m / 15分钟图 → 分析1分钟和5分钟
- 🛠 **Code Refactoring / 代码重构**: Implemented Pine Script v6 UDTs (Objects) and Methods for robust signal statistics. / 实现Pine Script v6 UDT(对象)和方法,增强信号统计的健壮性。
- 🎨 **Dashboard Optimization / 面板优化**: Enhanced string formatting using `str.format` for cleaner display. / 使用`str.format`优化字符串格式,显示更简洁。
### v4.0 - Pine Script v6 Upgrade / Pine Script v6升级
- 🚀 Upgraded entire codebase to **Pine Script v6** engine / 将整个代码库升级到 **Pine Script v6** 引擎
- ⚡ Optimization for better performance and future-proofing / 性能优化,面向未来
- 🛠 Maintenance updates for latest TradingView standards / 维护更新以符合最新TradingView标准
### v3.0 - Auto-Adaptive Systems / 自动自适应系统
- ✨ Auto-adaptive lookback using formula `n = (Z × σ / E)²` / 使用统计公式 `n = (Z × σ / E)²` 自动计算回看期
- ✨ Auto-adaptive trend filter with 5 modes / 5种模式的自动自适应趋势过滤器
- ✨ Auto-adaptive divergence detection with 4 presets / 4种预设的自动自适应背离检测
- ✨ Layered statistics (MTF/Divergence/Extreme/Normal) / 分层统计系统(MTF/背离/极端/普通)
- ✨ Signal cooldown to prevent duplicate counting / 信号冷却机制防止重复计数
- ✨ Health indicators for lookback validation / 回看期健康度指标验证
- ✨ Dashboard modes (Lite/Full) with customization / 面板模式(Lite/Full)支持自定义大小和透明度
- ✨ Dual volatility system (short + long-term) / 双重波动率系统(短期+长期)
### v2.1 - Signal Optimization / 信号优化
- ✨ Consolidated signals with priority system / 信号合并与优先级系统(无重叠)
- ✨ Emoji-based signal display / 基于Emoji的信号显示
- ✨ MTF timeframe auto-skip for duplicates / MTF时间框架自动跳过重复
### v2.0 - Pro Edition / 专业版
- ✨ Added Trend Filter, MTF RSI, Statistics, Divergence / 新增趋势过滤、MTF RSI、统计、背离检测
- ✨ Z-Score based signal triggering / 基于Z-Score的信号触发
### v1.0 - Initial Release / 初始发布
- ✨ Adaptive percentile-based thresholds / 自适应百分位阈值
---
## License
MIT License - Feel free to use, modify, and share.
开源脚本
秉承TradingView的精神,该脚本的作者将其开源,以便交易者可以查看和验证其功能。向作者致敬!您可以免费使用该脚本,但请记住,重新发布代码须遵守我们的网站规则。
免责声明
这些信息和出版物并非旨在提供,也不构成TradingView提供或认可的任何形式的财务、投资、交易或其他类型的建议或推荐。请阅读使用条款了解更多信息。
免责声明
这些信息和出版物并非旨在提供,也不构成TradingView提供或认可的任何形式的财务、投资、交易或其他类型的建议或推荐。请阅读使用条款了解更多信息。