OPEN-SOURCE SCRIPT
ATR Stop-Loss with Fibonacci Take-Profit [jpkxyz]

ATR Stop-Loss with Fibonacci Take-Profit Indicator
This comprehensive indicator combines Average True Range (ATR) volatility analysis with Fibonacci extensions to create dynamic stop-loss and take-profit levels. It's designed to help traders set precise risk management levels and profit targets based on market volatility and mathematical ratios.
Two Operating Modes
Default Mode (Rolling Levels)
In default mode, the indicator continuously plots evolving stop-loss and take-profit levels based on real-time price action. These levels update dynamically as new bars form, creating rolling horizontal lines across the chart. I use this mode primarily to plot the rolling ATR-Level which I use to trail my Stop-Loss into profit.

Characteristics:
Custom Anchor Mode (Fixed Levels)
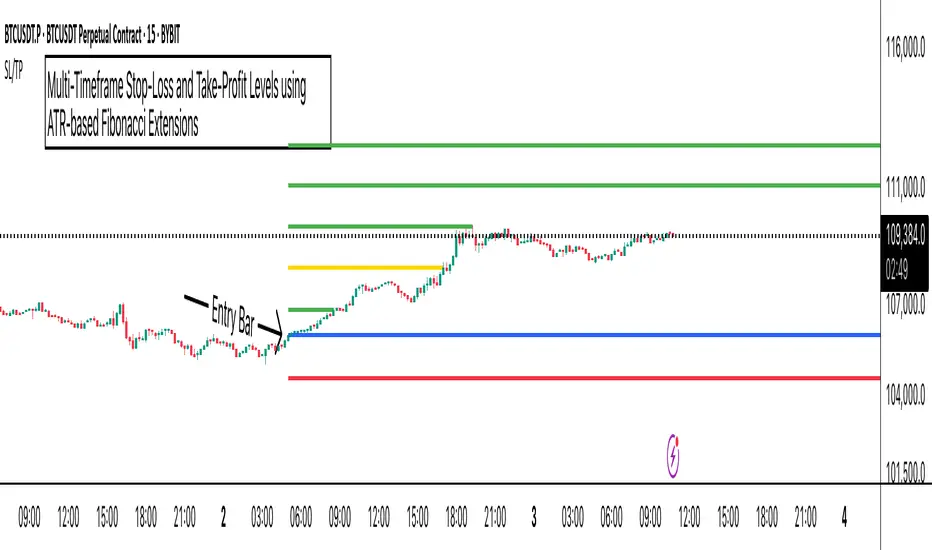
This is the primary mode for precision trading. You select a specific timestamp (typically your entry bar), and the indicator locks all calculations to that exact moment, creating fixed horizontal lines that represent your actual trade levels.

Characteristics:
Core Calculation Logic
ATR Stop-Loss Calculation:
Pine Script®
Fibonacci Take-Profit Projection:
The distance from entry to stop-loss becomes the base unit (1.0) for Fibonacci extensions:
Pine Script®
Available Fibonacci Levels:
Multi-Timeframe Functionality
One of the indicator's most powerful features is timeframe flexibility. You can analyze on one timeframe while using stop-loss and take-profit calculations from another.
Best Practices:
Example Scenario:
Visual Intelligence System
Line Behaviour in Custom Anchor Mode:
Customisation Options:
This comprehensive indicator combines Average True Range (ATR) volatility analysis with Fibonacci extensions to create dynamic stop-loss and take-profit levels. It's designed to help traders set precise risk management levels and profit targets based on market volatility and mathematical ratios.
Two Operating Modes
Default Mode (Rolling Levels)
In default mode, the indicator continuously plots evolving stop-loss and take-profit levels based on real-time price action. These levels update dynamically as new bars form, creating rolling horizontal lines across the chart. I use this mode primarily to plot the rolling ATR-Level which I use to trail my Stop-Loss into profit.
Characteristics:
- Levels recalculate with each new bar
- All selected Fibonacci levels display simultaneously
- Uses plot() functions with trackprice=true for price tracking
Custom Anchor Mode (Fixed Levels)
This is the primary mode for precision trading. You select a specific timestamp (typically your entry bar), and the indicator locks all calculations to that exact moment, creating fixed horizontal lines that represent your actual trade levels.
Characteristics:
- Entry line (blue) marks your anchor point
- Stop-loss calculated using ATR from the anchor bar
- Fibonacci levels projected from entry-to-stop distance
- Lines terminate when price breaks through them
- Includes comprehensive alert system
Core Calculation Logic
ATR Stop-Loss Calculation:
Stop Loss = Entry Price ± (ATR × Multiplier)
- Long positions: SL = Entry - (ATR × Multiplier)
- Short positions: SL = Entry + (ATR × Multiplier)
- ATR uses your chosen smoothing method (RMA, SMA, EMA, or WMA)
- Default multiplier is 1.5, adjustable to your risk tolerance
Fibonacci Take-Profit Projection:
The distance from entry to stop-loss becomes the base unit (1.0) for Fibonacci extensions:
TP Level = Entry + (Entry-to-SL Distance × Fibonacci Ratio)
Available Fibonacci Levels:
- Conservative: 0.618, 1.0, 1.618
- Extended: 2.618, 3.618, 4.618
- Complete range: 0.0 to 4.764 (23 levels total)
Multi-Timeframe Functionality
One of the indicator's most powerful features is timeframe flexibility. You can analyze on one timeframe while using stop-loss and take-profit calculations from another.
Best Practices:
- Identify your entry point on execution timeframe
- Enable "Custom Anchor" mode
- Set anchor timestamp to your entry bar
- Select appropriate analysis timeframe
- Choose relevant Fibonacci levels
- Enable alerts for automated notifications
Example Scenario:
- Analyse trend on 4-hour chart
- Execute entry on 5-minute chart for precision
- Set custom anchor to your 5-minute entry bar
- Configure timeframe setting to "4h" for swing-level targets
- Select appropriate Fibonacci Extension levels
- Result: Precise entry with larger timeframe risk management
Visual Intelligence System
Line Behaviour in Custom Anchor Mode:
- Active levels: Lines extend to the right edge
- Hit levels: Lines terminate at the breaking bar
- Entry line: Always visible in blue
- Stop-loss: Red line, terminates when hit
- Take-profits: Green lines (1.618 level in gold for emphasis)
Customisation Options:
- Line width (1-4 pixels)
- Show/hide individual Fibonacci levels
- ATR length and smoothing method
- ATR multiplier for stop-loss distance
开源脚本
秉承TradingView的精神,该脚本的作者将其开源,以便交易者可以查看和验证其功能。向作者致敬!您可以免费使用该脚本,但请记住,重新发布代码须遵守我们的网站规则。
免责声明
这些信息和出版物并非旨在提供,也不构成TradingView提供或认可的任何形式的财务、投资、交易或其他类型的建议或推荐。请阅读使用条款了解更多信息。
开源脚本
秉承TradingView的精神,该脚本的作者将其开源,以便交易者可以查看和验证其功能。向作者致敬!您可以免费使用该脚本,但请记住,重新发布代码须遵守我们的网站规则。
免责声明
这些信息和出版物并非旨在提供,也不构成TradingView提供或认可的任何形式的财务、投资、交易或其他类型的建议或推荐。请阅读使用条款了解更多信息。