OPEN-SOURCE SCRIPT
已更新 Stochastic and RSI in one indicator with customized alert.
Hello Trading Viewers,
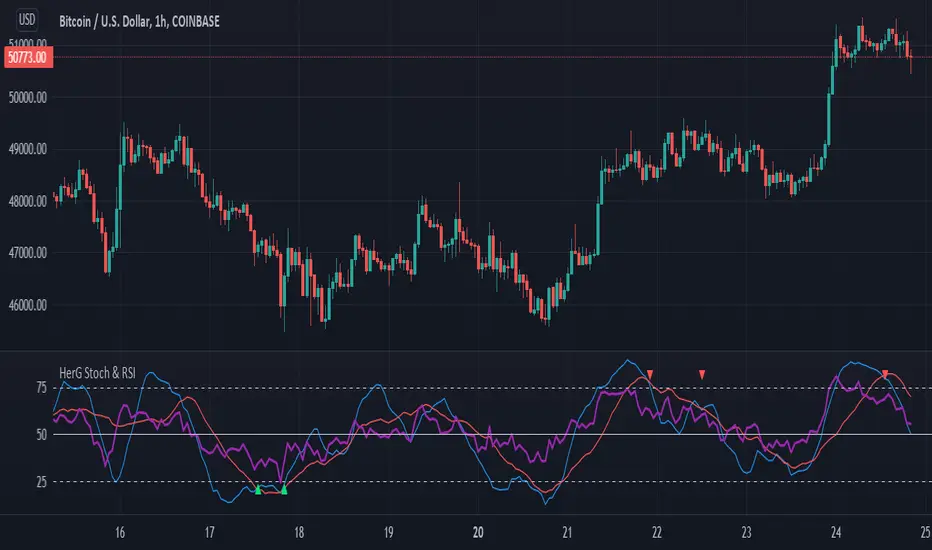
I present you Stochastic Oscillator and The Relative Strength Index Indicator inside one indicator, so that it will clear room to view charts.
When Stochastic is over-sold, the fast and slow stochastic underlap along with strong RSI (say above 45) will be a good indicator of buy at low with good risk-to-return of 2x or 3x; therefore I have set a triangle shape indicator within to help you identify or you can simply set an alert as I have coded an customized alert.
Same idea is used when Stochastic is over-bought you will receive an alert when fast & slow stochastic overlaps with RSI falling give a good sell set-up.
There is an option of selecting different timeframes which will further help make the correct decision. Say you are viewing a Daily chart but you want an indicator to present data of 4hrs timeframe, it can be done from the indicator cogwheel option. Default timeframe is "same as charts' ".
Above indicator is universal because settings such as RSI levels and no. of bars to calculate are user defined. You can use it on Crypto, Commodities, Stocks etc.
I suggest you first paper-trade with it and then use it on live account.
Happy trading.
版本注释
Request from newbr08, I have updated Alert condition. Trading Viewers can now select any of three alert options, Buy/Sell Signal, Buy Signal, and Sell Signal. Merry Christmas to all.
开源脚本
秉承TradingView的精神,该脚本的作者将其开源,以便交易者可以查看和验证其功能。向作者致敬!您可以免费使用该脚本,但请记住,重新发布代码须遵守我们的网站规则。
免责声明
这些信息和出版物并非旨在提供,也不构成TradingView提供或认可的任何形式的财务、投资、交易或其他类型的建议或推荐。请阅读使用条款了解更多信息。
开源脚本
秉承TradingView的精神,该脚本的作者将其开源,以便交易者可以查看和验证其功能。向作者致敬!您可以免费使用该脚本,但请记住,重新发布代码须遵守我们的网站规则。
免责声明
这些信息和出版物并非旨在提供,也不构成TradingView提供或认可的任何形式的财务、投资、交易或其他类型的建议或推荐。请阅读使用条款了解更多信息。