OPEN-SOURCE SCRIPT
HIGH LOW SAR
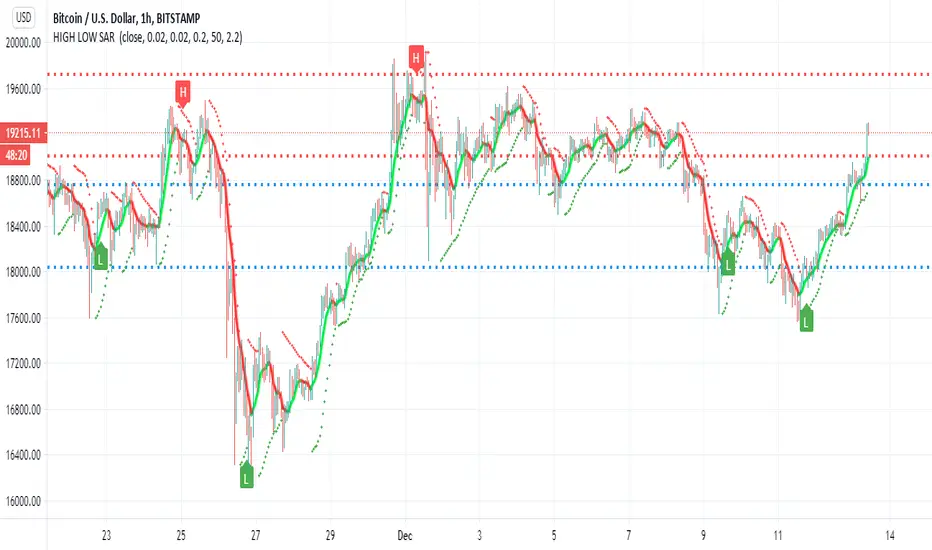
This script i try to detect high and low using SAR
the red and blue lines represent present and past support and resistance level
the trend line in lime and red is Hull
sar signals of high and low are done by cross of SAR and bollinger channel upper and lower and condition that it either below or above the resistance and support levels
there are alerts but i think as a bot it not so good , better to use this one as idea for possible high and low where the targets are shown by resistance and support level
this is just idea how to make the SAR to show us high and low , maybe with more refinement it would be better
开源脚本
秉承TradingView的精神,该脚本的作者将其开源,以便交易者可以查看和验证其功能。向作者致敬!您可以免费使用该脚本,但请记住,重新发布代码须遵守我们的网站规则。
免责声明
这些信息和出版物并非旨在提供,也不构成TradingView提供或认可的任何形式的财务、投资、交易或其他类型的建议或推荐。请阅读使用条款了解更多信息。
开源脚本
秉承TradingView的精神,该脚本的作者将其开源,以便交易者可以查看和验证其功能。向作者致敬!您可以免费使用该脚本,但请记住,重新发布代码须遵守我们的网站规则。
免责声明
这些信息和出版物并非旨在提供,也不构成TradingView提供或认可的任何形式的财务、投资、交易或其他类型的建议或推荐。请阅读使用条款了解更多信息。