PROTECTED SOURCE SCRIPT
trendOsilator
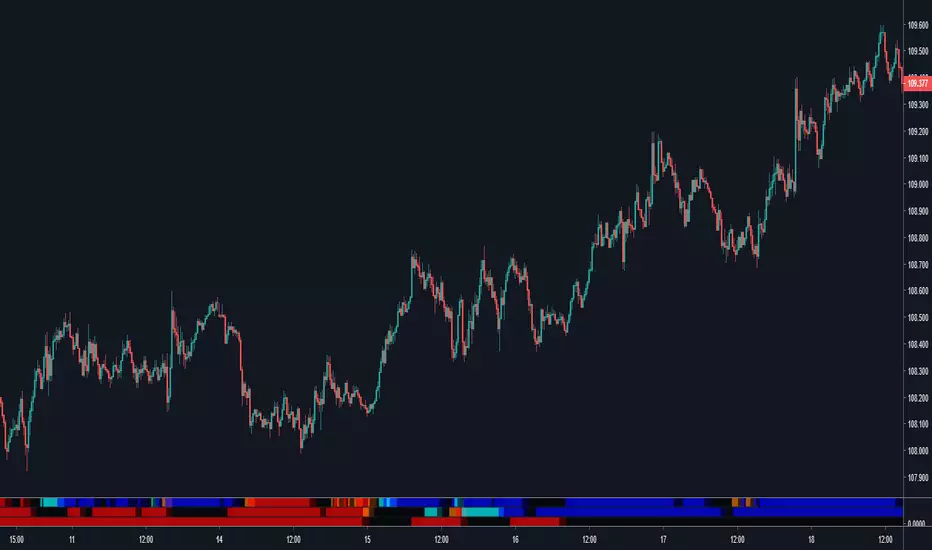
複数の移動平均線を用いてトレンドの強さを3本の線と色で表します。
MAをメインウインドウに表示したくないけど、トレンドの強さをMAで判定したい方などにおすすめです。
バーの色の意味は以下の通り。
(buy)blue -> aqua-> black -> orange -> red(sell)
それぞれのバーの意味は以下の通り。
トップ:短期足
ミドル:中期足
ボトム:長期足
三本のラインはそれぞれ「短期」、「中期」「長期」を表示しています。
マルチタイムフレームのMAの利用しているので表示する時間足によって結果は変化しません。
一旦、パラメータは設定できないようにしており、15M足を推奨しています。
要望があれば入力パラメータ有のバージョンを公開もする予定です。
--------------------------------------------------------------------------------------------------------------------------------------------------------------------------------
We use multiple moving average lines to express the trend strength with three lines and colors.
I do not want to display the MA in the main window, but it is recommended for those who want to judge the intensity of the trend with MA.
The meaning of the color of the bar is as follows.
(buy) blue -> aqua -> black -> orange -> red (sell)
The meaning of each bar is as follows.
Top: Short-term foot
Middle: Middle leg
Bottom: long-term foot
The three lines indicate "short term", "medium term" and "long term", respectively.
Because we are using multi-time frame MA, the result does not change depending on the time span displayed.
Once we can not set the parameters, 15M foot is recommended.
We will also release versions with input parameters if requested.
受保护脚本
此脚本以闭源形式发布。 但是,您可以自由使用,没有任何限制 — 了解更多信息这里。
免责声明
这些信息和出版物并非旨在提供,也不构成TradingView提供或认可的任何形式的财务、投资、交易或其他类型的建议或推荐。请阅读使用条款了解更多信息。
免责声明
这些信息和出版物并非旨在提供,也不构成TradingView提供或认可的任何形式的财务、投资、交易或其他类型的建议或推荐。请阅读使用条款了解更多信息。