INVITE-ONLY SCRIPT
DepthHouse RSI Grid MTF
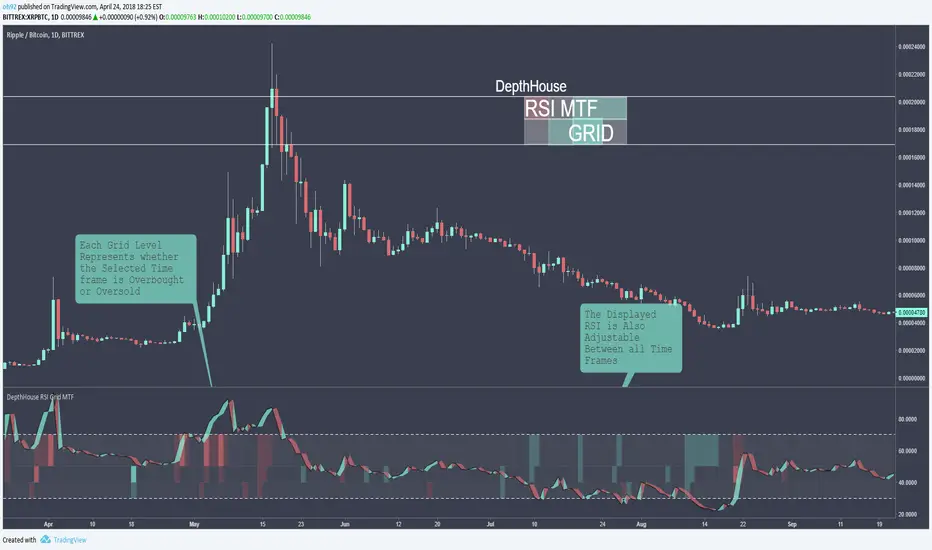
DepthHouse RSI Grid MTF is used to determine overbought and oversold levels based on the RSI across multiple time frames.
The default time frames are the 30m, 2H, 8H and 16H however these are completely adjustable.
This indicator also allows the user to select which RSI band to display based on the time frame.
The default is set to the current time frame, however the user can select any of the other four time frames.
OverBought & Oversold Levels are also entirely adjustable.
Meaning you can adjust the 30, 70 ranges, and it will alter the overbought and oversold values across ALL timeframes.
How to get:
As you can see this is an invite only script. In the coming month this indicator, along with many others will become pay to use only. (website on my profile page)
However all my indicators will be FREE until May 1, 2018. So please try them out!
To take advantage of this free trial:
Just leave a comment!
IF you are viewing this after May 1st. Please feel free to send me a PM or visit my website.
Creator of DepthHouse Indicators on TradingView!
↣ depthhouse.com/
↣ depthhouse.com/
免责声明
这些信息和出版物并不意味着也不构成TradingView提供或认可的金融、投资、交易或其它类型的建议或背书。请在使用条款阅读更多信息。