INVITE-ONLY SCRIPT
Basma Tadawul KSA 2023

The Basma Tadawul indicator depends on the nature of history redrawing itself and on the recurrence of price movement
discovered by astronomical analysis
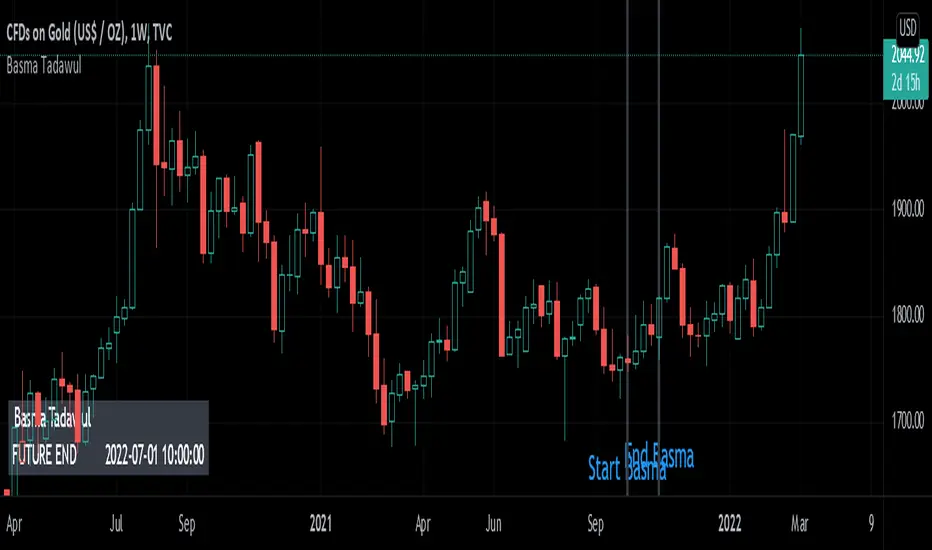
The indicator draws three columns that determine the beginning and end of the repetition of the movement forecast. We use the pattern clipping indicator to make a match between the current chart and the future forecast of the chart.
When the chart matches a specific percentage from the beginning of the pattern cut, it is confirmed that the imprint is real and we adopt the future forecast for the rest of the pattern
How to use Basma Tadawul System:
After placing the indicator on the chart, it will draw three virtical lines that show the beginning and end of the movement expected to be repeated
We use the tool to cut the pattern and draw it on the beginning and end of the forecast and then use it to predict the next price movement starting from the end of the previous movement
仅限邀请脚本
只有作者授权的用户才能访问此脚本。您需要申请并获得使用许可。通常情况下,付款后即可获得许可。更多详情,请按照下方作者的说明操作,或直接联系Basmatadawul。
TradingView不建议您付费购买或使用任何脚本,除非您完全信任其作者并了解其工作原理。您也可以在我们的社区脚本找到免费的开源替代方案。
作者的说明
Telegram: https://t.me/+cHRLRD8CocU0ZDM0 Email:hajed1671@gmail.com
免责声明
这些信息和出版物并非旨在提供,也不构成TradingView提供或认可的任何形式的财务、投资、交易或其他类型的建议或推荐。请阅读使用条款了解更多信息。