OPEN-SOURCE SCRIPT
已更新 HDW open_close
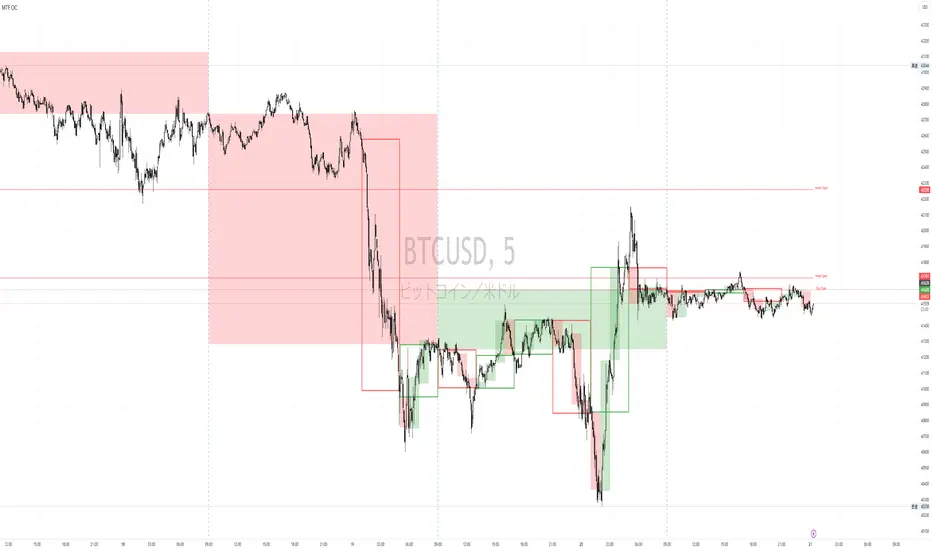
上位時間軸のロウソク足を表示したくて、それに代わるものが見つからなかったので作ってみました。
1時間足、日足、週足の始値と終値をラインで表示するものです。
ヒゲの部分は作っていません。実体を見て判断します。
【Google translate】
I wanted to display the candlestick on the upper time axis, so I could not find an alternative to it, so I made it.
It displays the start value and closing price of 1 hour foot, daily stick, weekly leg with a line.
1時間足、日足、週足の始値と終値をラインで表示するものです。
ヒゲの部分は作っていません。実体を見て判断します。
【Google translate】
I wanted to display the candlestick on the upper time axis, so I could not find an alternative to it, so I made it.
It displays the start value and closing price of 1 hour foot, daily stick, weekly leg with a line.
版本注释
改正・枠内の塗りつぶし
・各時間軸のOn/Off
・月足追加(デフォルト:OFF)
Revision
· Fill in the frame
· On / Off on each time axis
· Add monthly feet (default: OFF)
版本注释
スタイルに表示されている文字の誤記を訂正しました。Corrected mistyping of characters displayed in style.
版本注释
改正・4時間足を追加
・入力タブの線幅項目削除
Revision
· Add:4 hour bar
· Delete:line width item on input tab
版本注释
・ Convert to Ver4・ Code review and weight reduction
・ Add fill and frame switching
版本注释
ChangeTitle: Multi Time Frame Open Close
Short Title: Mtf OC
Add: fill density magnification
版本注释
Change the ON / OFF setting method.0: Not displayed
1-4: Line width (valid only when there is no fill)
5: Fill
ON/OFF設定方法変更。
0:非表示
1-4:線幅(塗りつぶし無の時のみ有効)
5:塗りつぶし
版本注释
Fixed a bug that the foot is not filled for 1 hour.Fixed a typo in the property notation.
版本注释
The source has not changed.This is because I was displaying a different one on the chart screen...
版本注释
訂正・閉じていない時間軸の現在のラインを表示しないように訂正
・陽線、陰線のカラーを一括で変更できるように訂正
・pine version 5にコード訂正
//Google Translation
correction
- Corrected so that the current line of the unclosed time axis is not displayed.
- Corrected so that you can change the color of positive and negative lines at once.
・Code correction to pine version 5
版本注释
訂正※暫定対応(tradingviewの仕様、request.securityにより上位足を取得した場合、リアルタイムデータでは任意の時間足の更新のタイミングで過去データのようには取得できない為)
・リアルタイム中における上位足の更新不具合を下記のように訂正しました。
・1時間足と4時間足に関しては、plotをやめboxを使うように変更。
その為、オブジェクトの数に制限がかかる為、ある程度の過去までしか表示できません。
・日足、週足、月足に関しては、前回同様の仕様でplotによるラインで表示しています。
その為、リアルタイムからの更新は、上手く表示されませんので、手動で再度描画し直して下さい。(日足を跨ぐ事はあるかもしれませんが、つけっぱなしにする事は無いと思われるためこのような暫定対応にしました。リプレイを使用する場合は、そのような不具合がでるため注意して下さい。)
・日足、週足、月足を表示する際は、始まり値のラインも追加で引くよう訂正しました。
//Google translation//
Correction
※Temporary support
(Tradingview specifications, if you obtain top bars using request.security, real-time data cannot be obtained like past data at the timing of updating any time frame)
・ Corrected the bug in updating the top bar in real time as follows.
・For the 1-hour and 4-hour charts, I stopped using plot and changed to using box.
As a result, the number of objects is limited, so it is only possible to display a certain amount of time in the past.
・Daily, weekly, and monthly data are displayed using plot lines with the same specifications as last time.
Therefore, updates from real time will not display well, so please redraw them manually. (Although there may be times when the daily chart crosses over, it is unlikely that it will be left on, so we have taken this temporary measure. When using replay, be careful as such problems may occur. please do it.)
・When displaying daily, weekly, and monthly charts, the starting value line has been corrected to be drawn additionally.
开源脚本
秉承TradingView的精神,该脚本的作者将其开源,以便交易者可以查看和验证其功能。向作者致敬!您可以免费使用该脚本,但请记住,重新发布代码须遵守我们的网站规则。
免责声明
这些信息和出版物并非旨在提供,也不构成TradingView提供或认可的任何形式的财务、投资、交易或其他类型的建议或推荐。请阅读使用条款了解更多信息。
免责声明
这些信息和出版物并非旨在提供,也不构成TradingView提供或认可的任何形式的财务、投资、交易或其他类型的建议或推荐。请阅读使用条款了解更多信息。