OPEN-SOURCE SCRIPT
Nadaraya-Watson Envelope: Modified by Yosiet
Range Filter indicator based on the LuxAlgo Nadaraya-Watson Envelope (tradingview.com/v/Iko0E2kL/) indicator adding the SMA 30 high and SMA 7 low to predict the changes of the trends lines price.
WARNING: This indicator, as the same as the original, repaints the chart and could affect the exact values of the prices.
SMA Low 7 was identified using tensorflowJS years ago as accurate and abstract rsi indicator
SMA High 30 was identified using tensorflowJS years ago as accurate and strong trend line
This two SMAs were added to the original indicator Nadaraya-Watson to predict the exact points where the price will change direction or will re-test the trend to continue on.
The signals will act as the Williams Fractals, replacing the original signals of the indicator.
For those ICT/SMC traders, the bands and SMAs can toggle off in the settings of this indicator.
SETTINGS
ALERTS AND SIGNALS
HOW TO USE IT
DISCLAIMER: This indicator or script does not imply or constitute financial advice, investment advice, trading advice or any other type of advice or recommendation by and for TradingView. Use it at your own risk and your own decision.
WARNING: This indicator, as the same as the original, repaints the chart and could affect the exact values of the prices.
SMA Low 7 was identified using tensorflowJS years ago as accurate and abstract rsi indicator
SMA High 30 was identified using tensorflowJS years ago as accurate and strong trend line
This two SMAs were added to the original indicator Nadaraya-Watson to predict the exact points where the price will change direction or will re-test the trend to continue on.
The signals will act as the Williams Fractals, replacing the original signals of the indicator.
For those ICT/SMC traders, the bands and SMAs can toggle off in the settings of this indicator.
SETTINGS
- Can set the source of the UPPER band indivuadilly
- Can set the source of the LOWER band indivuadilly
- Can toggle the visibility of the bands, this will not affect the calculations
- Can toggle the visibility of SMAs
ALERTS AND SIGNALS
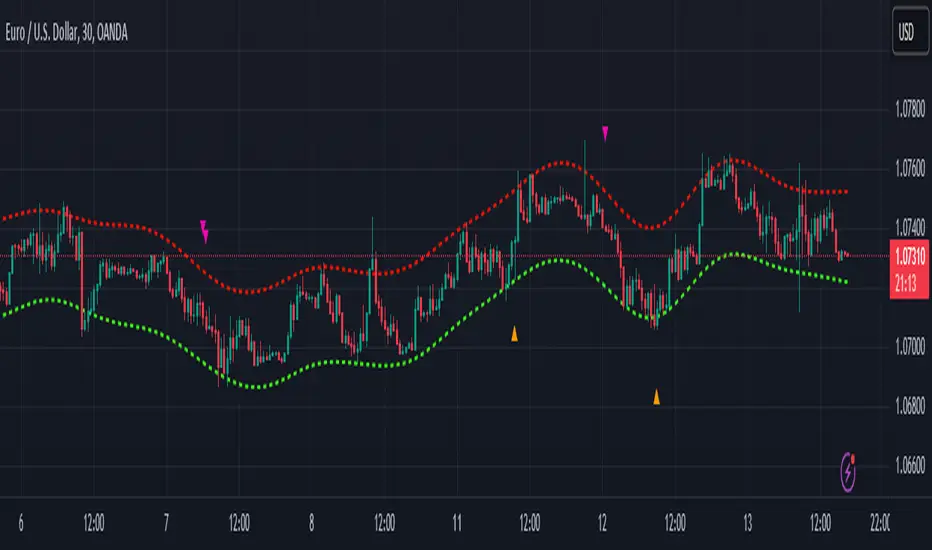
- When the SMA LOW 7 cross under or over the bands, will trigger a signal orange
- When the SMA 30 High cross over the upper band, will trigger a short signal purpple
HOW TO USE IT
- If the both signals appears (sma 7 low and sma 30 high) crossing the upper band at the same point, this means that the price will drop strongly.
- If the sma 7 low cross signal (orange triangle) appears under the price and lower band, means that the price will go up.
- The separation of the signals from the chart will suggest the force of the movement. While more distance be, strongest reaction of the price.
DISCLAIMER: This indicator or script does not imply or constitute financial advice, investment advice, trading advice or any other type of advice or recommendation by and for TradingView. Use it at your own risk and your own decision.
开源脚本
秉承TradingView的精神,该脚本的作者将其开源,以便交易者可以查看和验证其功能。向作者致敬!您可以免费使用该脚本,但请记住,重新发布代码须遵守我们的网站规则。
免责声明
这些信息和出版物并非旨在提供,也不构成TradingView提供或认可的任何形式的财务、投资、交易或其他类型的建议或推荐。请阅读使用条款了解更多信息。
开源脚本
秉承TradingView的精神,该脚本的作者将其开源,以便交易者可以查看和验证其功能。向作者致敬!您可以免费使用该脚本,但请记住,重新发布代码须遵守我们的网站规则。
免责声明
这些信息和出版物并非旨在提供,也不构成TradingView提供或认可的任何形式的财务、投资、交易或其他类型的建议或推荐。请阅读使用条款了解更多信息。