PROTECTED SOURCE SCRIPT
[MattLet] RSI Andrew Cardwell
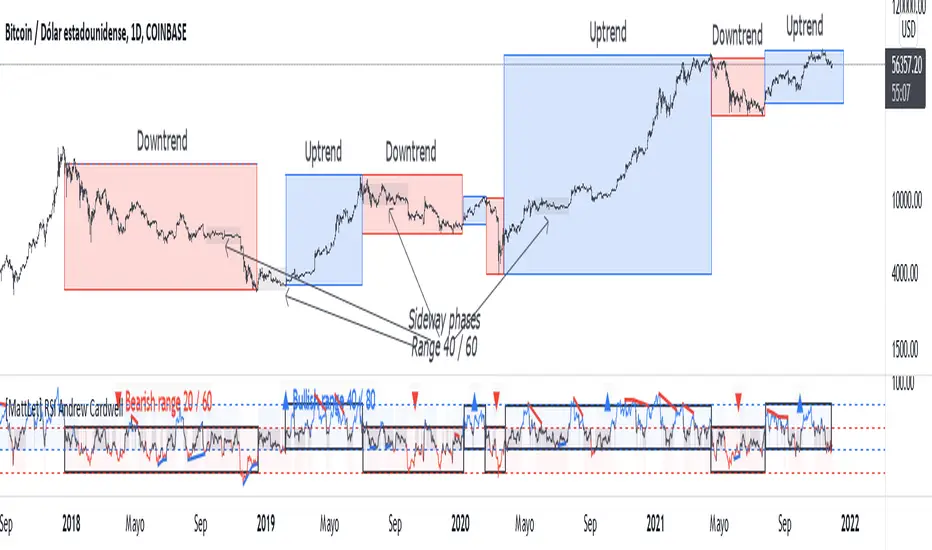
Andrew Cardwell RSI helps to identify the range shift, which states whether the market is in bullish or bearish phase.
When RSI oscillates in the range of 40 to 80 we can said that we are in a uptrend (blue background color on RSI), however when RSI oscillates in the range of 20 to 60 we are in a downtrend (red background color on RSI).
Finally if the RSI oscillates between 40 to 60, it is considerated a sideway phase (gray background color on RSI).
Keep in mind that within an uptrend or downtrend there may be a lateral phases and then continue in the trend (gray boxes on the BTC/USD price xample)
I added bearish and bullish divergences (hidden divergences too) to help users to indentify possible trending endings.
Note: I still working improving how the indicator display the areas, so I will letting you know when I finish that. Anyway, you can use it normally right now.
Good Luck!
受保护脚本
此脚本以闭源形式发布。 但是,您可以自由使用,没有任何限制 — 了解更多信息这里。
免责声明
这些信息和出版物并非旨在提供,也不构成TradingView提供或认可的任何形式的财务、投资、交易或其他类型的建议或推荐。请阅读使用条款了解更多信息。
受保护脚本
此脚本以闭源形式发布。 但是,您可以自由使用,没有任何限制 — 了解更多信息这里。
免责声明
这些信息和出版物并非旨在提供,也不构成TradingView提供或认可的任何形式的财务、投资、交易或其他类型的建议或推荐。请阅读使用条款了解更多信息。