PROTECTED SOURCE SCRIPT
已更新 Price/Moving Average
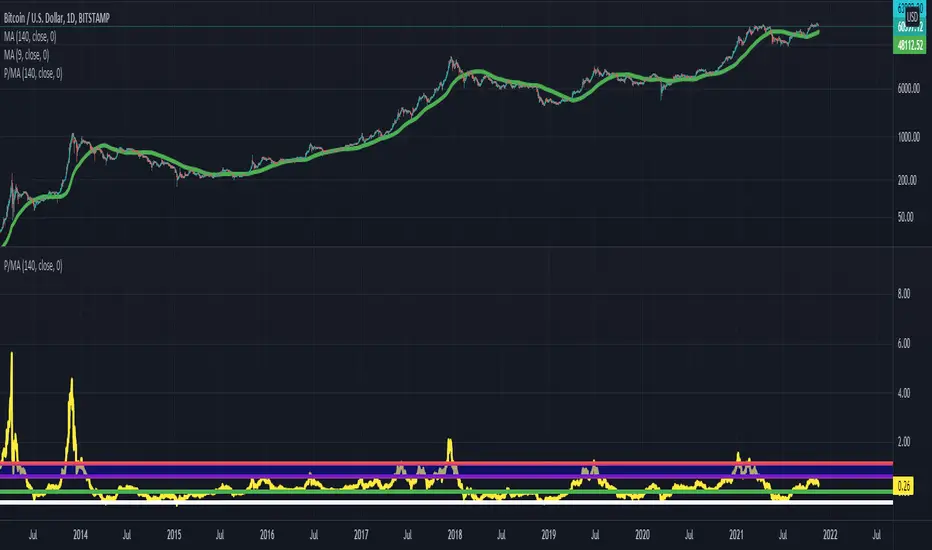
Price / Moving average indicator.
Support and resistance levels are established for Bitcoin.
When in a bear market, -50% below the 20 week MA acts as support.
When in a bull market, between 60% to 100% above the 20 week MA acts as resistance. Historically, these levels once hit, send Bitcoin back down to it's 20 week moving average.
In the setting of a bear market, historically, we do not ever get up to the 60% above the 20 week MA level.
Please note, this is only based on historical trends, and is not guaranteed to remain true in this or future market cycles.
版本注释
Remember, these values for support and resistance are not exact, in reality they vary by about 5-10% per cycle historically.受保护脚本
此脚本以闭源形式发布。 但是,您可以自由使用,没有任何限制 — 了解更多信息这里。
免责声明
这些信息和出版物并非旨在提供,也不构成TradingView提供或认可的任何形式的财务、投资、交易或其他类型的建议或推荐。请阅读使用条款了解更多信息。
免责声明
这些信息和出版物并非旨在提供,也不构成TradingView提供或认可的任何形式的财务、投资、交易或其他类型的建议或推荐。请阅读使用条款了解更多信息。