OPEN-SOURCE SCRIPT
VIX Spike Strategy
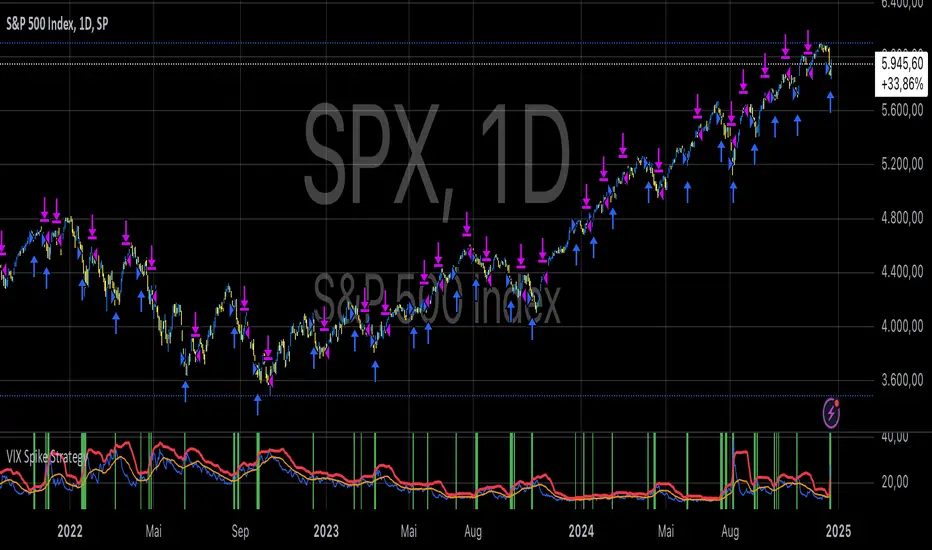
This script implements a trading strategy based on the Volatility Index (VIX) and its standard deviation. It aims to enter a long position when the VIX exceeds a certain number of standard deviations above its moving average, which is a signal of a volatility spike. The position is then exited after a set number of periods.
VIX Symbol (vix_symbol): The input allows the user to specify the symbol for the VIX index (typically "CBOE:VIX").
Standard Deviation Length (stddev_length): The number of periods used to calculate the standard deviation of the VIX. This can be adjusted by the user.
Standard Deviation Multiplier (stddev_multiple): This multiplier is used to determine how many standard deviations above the moving average the VIX must exceed to trigger a long entry.
Exit Periods (exit_periods): The user specifies how many periods after entering the position the strategy will exit the trade.
Strategy Logic:
Data Loading: The script loads the VIX data, both for the current timeframe and as a rescaled version for calculation purposes.
Standard Deviation Calculation: It calculates both the moving average (SMA) and the standard deviation of the VIX over the specified period (stddev_length).
Entry Condition: A long position is entered when the VIX exceeds the moving average by a specified multiple of its standard deviation (calculated as vix_mean + stddev_multiple * vix_stddev).
Exit Condition: After the position is entered, it will be closed after the user-defined number of periods (exit_periods).
Visualization:
The VIX is plotted in blue.
The moving average of the VIX is plotted in orange.
The threshold for the VIX, which is the moving average plus the standard deviation multiplier, is plotted in red.
The background turns green when the entry condition is met, providing a visual cue.
Sources:
The VIX is often used as a measure of market volatility, with high values indicating increased uncertainty in the market.
Standard deviation is a statistical measure of the variability or dispersion of a set of data points. In financial markets, it is used to measure the volatility of asset prices.
References:
Bollerslev, T. (1986). "Generalized Autoregressive Conditional Heteroskedasticity." Journal of Econometrics.
Black, F., & Scholes, M. (1973). "The Pricing of Options and Corporate Liabilities." Journal of Political Economy.
开源脚本
秉承TradingView的精神,该脚本的作者将其开源,以便交易者可以查看和验证其功能。向作者致敬!您可以免费使用该脚本,但请记住,重新发布代码须遵守我们的网站规则。
Where others speculate, we systematize.
edgetools.org
edgetools.org
免责声明
这些信息和出版物并非旨在提供,也不构成TradingView提供或认可的任何形式的财务、投资、交易或其他类型的建议或推荐。请阅读使用条款了解更多信息。
开源脚本
秉承TradingView的精神,该脚本的作者将其开源,以便交易者可以查看和验证其功能。向作者致敬!您可以免费使用该脚本,但请记住,重新发布代码须遵守我们的网站规则。
Where others speculate, we systematize.
edgetools.org
edgetools.org
免责声明
这些信息和出版物并非旨在提供,也不构成TradingView提供或认可的任何形式的财务、投资、交易或其他类型的建议或推荐。请阅读使用条款了解更多信息。