OPEN-SOURCE SCRIPT
VOLD-MarketBreadth-Ratio
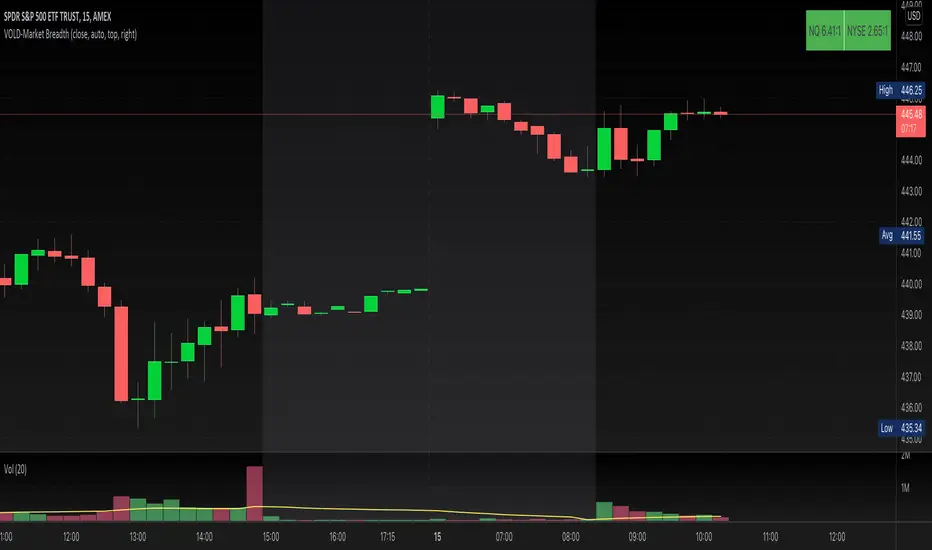
This script provides NASDAQ and NYSE Up Volume (volume in rising stocks) and Down Volume (volume in falling stocks) ratio. Up Volume is higher than Down Volume, then you would see green label with ratio e.g 3.5:1. This means Up Volume is 3.5 times higher than Down Volume - Positive Market Breadth. If Down Volume is higher than Up Volume, then you would see red label with ratio e.g -4.5:1. This means Down Volume is 4.5 times higher than Up Volume.
For example, ratio is 1:1, then it is considered Market Breadth is Neutral.
PS: Currently TradingView provides only NASDAQ Composite Market volume data. I have requested them to provide Primary NASDAQ volume data. If they respond with new ticket for primary NQ data, I will update the script and publish the updated version. So if you have got similar table on ToS, you would see minor difference in NQ ratio.
开源脚本
秉承TradingView的精神,该脚本的作者将其开源,以便交易者可以查看和验证其功能。向作者致敬!您可以免费使用该脚本,但请记住,重新发布代码须遵守我们的网站规则。
免责声明
这些信息和出版物并非旨在提供,也不构成TradingView提供或认可的任何形式的财务、投资、交易或其他类型的建议或推荐。请阅读使用条款了解更多信息。
免责声明
这些信息和出版物并非旨在提供,也不构成TradingView提供或认可的任何形式的财务、投资、交易或其他类型的建议或推荐。请阅读使用条款了解更多信息。