OPEN-SOURCE SCRIPT
CMP vs ATH Percentage
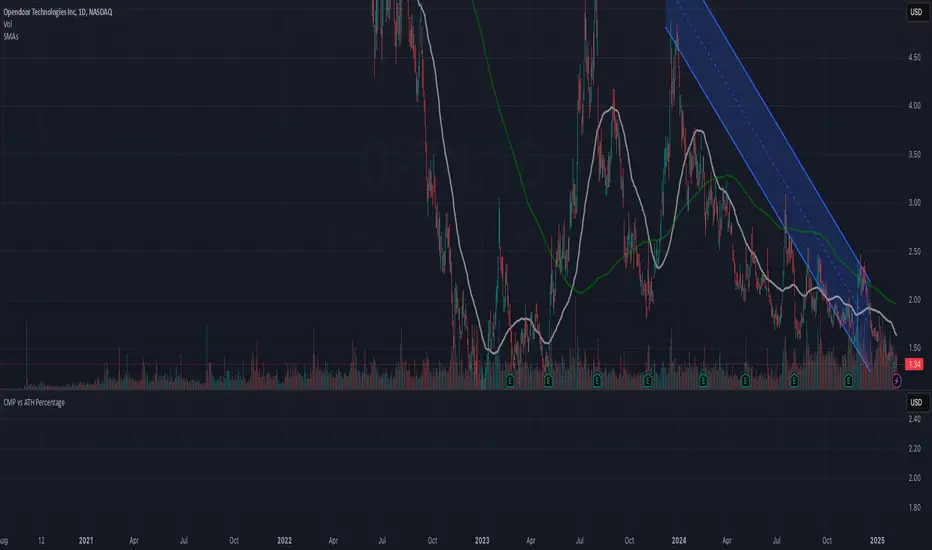
This indicator helps traders and investors track how the current market price (CMP) compares to the all-time high (ATH) price of an asset. It calculates the percentage difference between the CMP and ATH and displays it visually on the chart. A label is placed on the latest bar, showing key information like:
ATH (All-Time High Price)
CMP (Current Market Price)
Percentage Comparison (CMP as a percentage of ATH)
Additionally, the indicator plots a horizontal line at the ATH level to provide a clear visual reference for the price history.
Use Cases:
Identify price levels relative to historical highs.
Gauge whether the price is nearing or far from its ATH.
Quickly assess how much the price has recovered or declined from the ATH.
Customization:
You can modify the label's style, color, or text formatting according to your preferences. This indicator is useful for long-term analysis, especially when tracking stocks, indices, or other financial instruments on a weekly timeframe.
Note:
This indicator is designed to work on higher timeframes (e.g., daily or weekly) where ATH levels are more meaningful.
开源脚本
秉承TradingView的精神,该脚本的作者将其开源,以便交易者可以查看和验证其功能。向作者致敬!您可以免费使用该脚本,但请记住,重新发布代码须遵守我们的网站规则。
免责声明
这些信息和出版物并非旨在提供,也不构成TradingView提供或认可的任何形式的财务、投资、交易或其他类型的建议或推荐。请阅读使用条款了解更多信息。
免责声明
这些信息和出版物并非旨在提供,也不构成TradingView提供或认可的任何形式的财务、投资、交易或其他类型的建议或推荐。请阅读使用条款了解更多信息。