INVITE-ONLY SCRIPT
已更新 $ADD Indicator
Sign up at https://ticksurfers.com
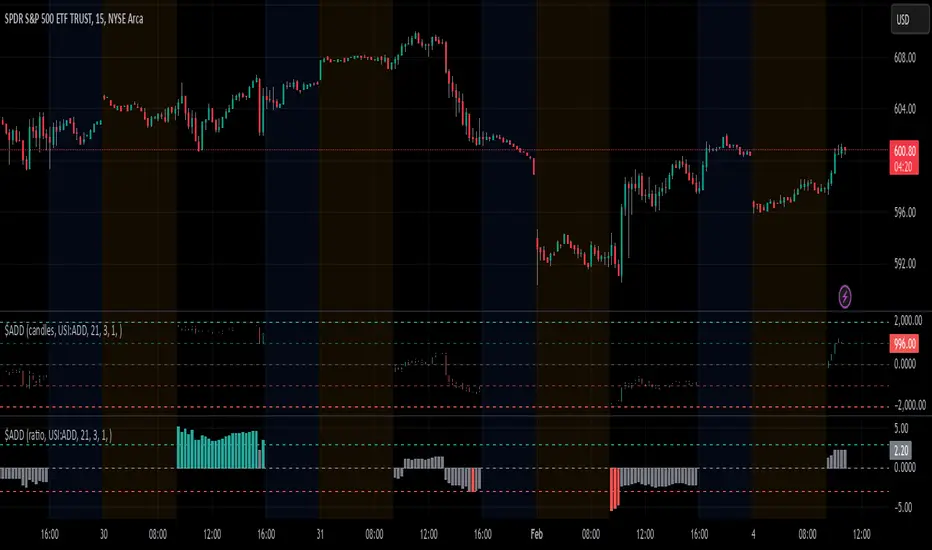
In index investment, the USI:ADD is the Advance Decline Index that can be plotted in most charting platforms. Just like there is a volatility index for most major indeces (VIX, VOLQ) and even for Apple (CBOE:VXAPL), USI:ADD also has variations specific for the index you are analyzing (SPX: ADD, NASDAQ: ADDQ).
The USI:ADD index is a measurement of stocks in the index that are advancing (bullish) minus those that are declining (bearish).
The basic idea of how to use the ADD index is that when the value is above 1000 it is considered overbought. Conversely, when the value is below -1000 it is considered oversold. When the value is near the medium line, it is not a good idea to trade as it is considered to be in a choppy market.
版本注释
Fixed bug with breadth thrust calculation版本注释
Updated ratio mode to highlight high ADD ratio, indicating potential of a trend day.仅限邀请脚本
只有作者授权的用户才能访问此脚本。您需要申请并获得使用许可。通常情况下,付款后即可获得许可。更多详情,请按照下方作者的说明操作,或直接联系TickSurfers。
请注意,此私密、仅限邀请脚本未经脚本版主审核,是否符合网站规则尚未确定。 TradingView不建议您付费购买或使用任何脚本,除非您完全信任其作者并了解其工作原理。您也可以在我们的社区脚本找到免费的开源替代方案。
作者的说明
Sign up at ticksurfers.com for access.
免责声明
这些信息和出版物并非旨在提供,也不构成TradingView提供或认可的任何形式的财务、投资、交易或其他类型的建议或推荐。请阅读使用条款了解更多信息。
仅限邀请脚本
只有作者授权的用户才能访问此脚本。您需要申请并获得使用许可。通常情况下,付款后即可获得许可。更多详情,请按照下方作者的说明操作,或直接联系TickSurfers。
请注意,此私密、仅限邀请脚本未经脚本版主审核,是否符合网站规则尚未确定。 TradingView不建议您付费购买或使用任何脚本,除非您完全信任其作者并了解其工作原理。您也可以在我们的社区脚本找到免费的开源替代方案。
作者的说明
Sign up at ticksurfers.com for access.
免责声明
这些信息和出版物并非旨在提供,也不构成TradingView提供或认可的任何形式的财务、投资、交易或其他类型的建议或推荐。请阅读使用条款了解更多信息。