OPEN-SOURCE SCRIPT
Daily ATR Tracker
Daily ATR Tracker
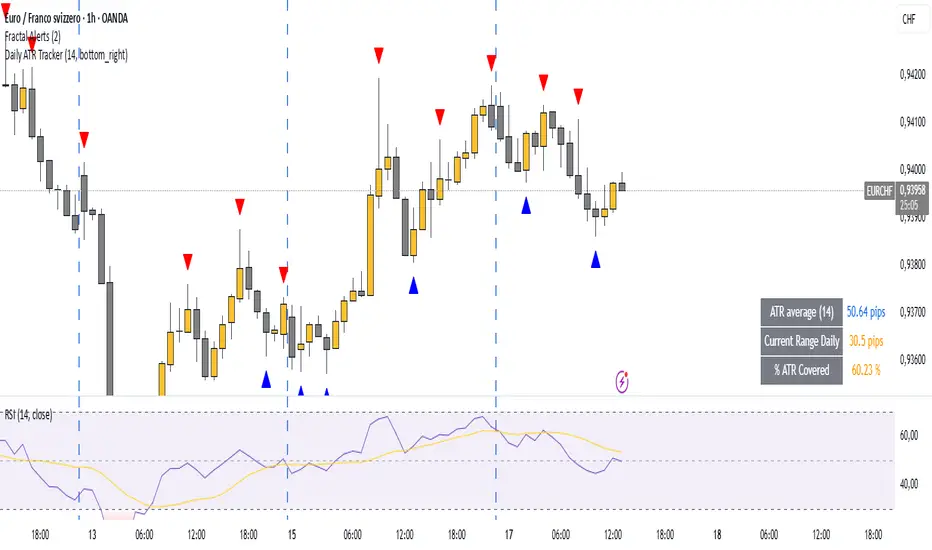
The Daily ATR Tracker is a simple yet powerful tool designed to help traders monitor the daily price movement relative to the average daily range (ATR). This indicator provides an objective view of how much price has moved compared to its recent daily volatility.
🔎 Key Features:
Customizable ATR period (default 14 days)
Live calculation of the current day's price range
ATR value displayed in pips for clear reference
Percentage of ATR covered by the current day's range
Color-coded table for quick visual interpretation:
🟢 Green: less than 60% of ATR covered
🟠 Orange: 60% to 100% of ATR covered
🔴 Red: more than 100% of ATR covered
Alert condition when daily range exceeds 100% of the ATR average
Movable table position to fit your chart layout
🎯 Why use Daily ATR Tracker?
✅ Identify exhaustion zones: When price has already covered a large portion of its typical daily range, the odds of further strong movement may diminish, helping you to manage entries, exits, and risk.
✅ Objective daily bias: Get a quantitative sense of how "stretched" the market is in real time.
✅ Works with any timeframe: While designed for daily ranges, you can monitor intraday movements with this context in mind.
⚠️ Usage Note:
This tool does not provide buy or sell signals by itself. It is designed to complement your existing strategies by offering additional context regarding daily range exhaustion.
开源脚本
秉承TradingView的精神,该脚本的作者将其开源,以便交易者可以查看和验证其功能。向作者致敬!您可以免费使用该脚本,但请记住,重新发布代码须遵守我们的网站规则。
免责声明
这些信息和出版物并非旨在提供,也不构成TradingView提供或认可的任何形式的财务、投资、交易或其他类型的建议或推荐。请阅读使用条款了解更多信息。
开源脚本
秉承TradingView的精神,该脚本的作者将其开源,以便交易者可以查看和验证其功能。向作者致敬!您可以免费使用该脚本,但请记住,重新发布代码须遵守我们的网站规则。
免责声明
这些信息和出版物并非旨在提供,也不构成TradingView提供或认可的任何形式的财务、投资、交易或其他类型的建议或推荐。请阅读使用条款了解更多信息。