OPEN-SOURCE SCRIPT
GL_Prev Week High
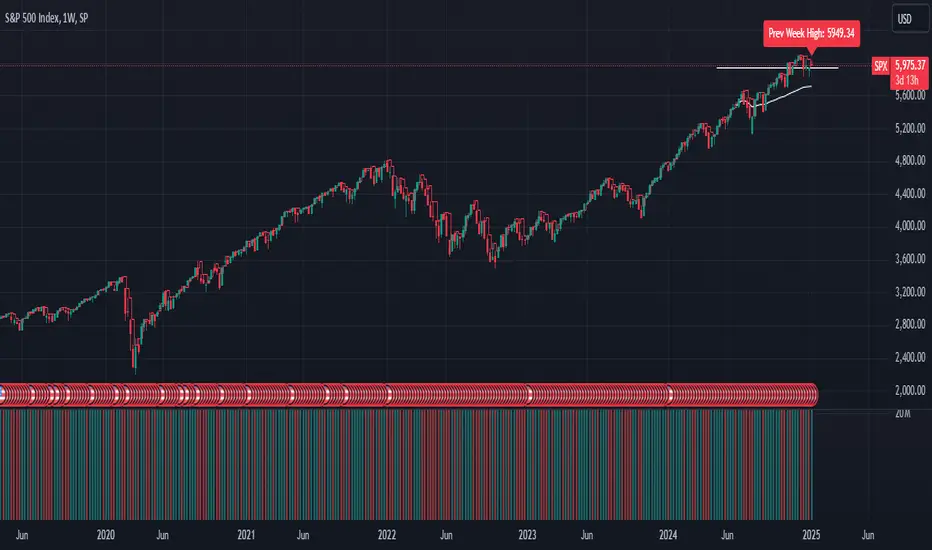
The GL_Prev Week High Indicator is a powerful tool designed to enhance your trading analysis by displaying the previous week's high price directly on your chart. With clear and customizable visuals, this indicator helps traders quickly identify critical price levels, enabling more informed decision-making.
Key Features:
Previous Week's High Line:
Displays the previous week's high as a red line on your chart for easy reference.
Customizable Horizontal Line:
Includes a white horizontal line for enhanced clarity, with adjustable length, color, and width settings.
All-Time High Tracking:
Automatically tracks the all-time high from the chart's history and places a dynamic label above it.
Real-Time Updates:
The indicator updates in real-time to ensure accuracy as new bars are added.
User Inputs for Personalization:
Adjust the left and right span of the horizontal line.
Customize line width and color to suit your preferences.
Use Case:
This indicator is ideal for traders looking to integrate the previous week's high as a key support or resistance level in their trading strategy. Whether you are analyzing trends, identifying breakout zones, or planning entry/exit points, this tool provides valuable insights directly on the chart.
How to Use:
Add the indicator to your chart.
Customize the settings (line length, width, and color) through the input panel to match your preferences.
Use the red line to track the previous week's high and the label to monitor all-time highs effortlessly.
License:
This script is shared under the Mozilla Public License 2.0. Feel free to use and adapt the script as per the license terms.
开源脚本
秉承TradingView的精神,该脚本的作者将其开源,以便交易者可以查看和验证其功能。向作者致敬!您可以免费使用该脚本,但请记住,重新发布代码须遵守我们的网站规则。
免责声明
这些信息和出版物并非旨在提供,也不构成TradingView提供或认可的任何形式的财务、投资、交易或其他类型的建议或推荐。请阅读使用条款了解更多信息。
免责声明
这些信息和出版物并非旨在提供,也不构成TradingView提供或认可的任何形式的财务、投资、交易或其他类型的建议或推荐。请阅读使用条款了解更多信息。