OPEN-SOURCE SCRIPT
已更新 RS - Relative Strength Score
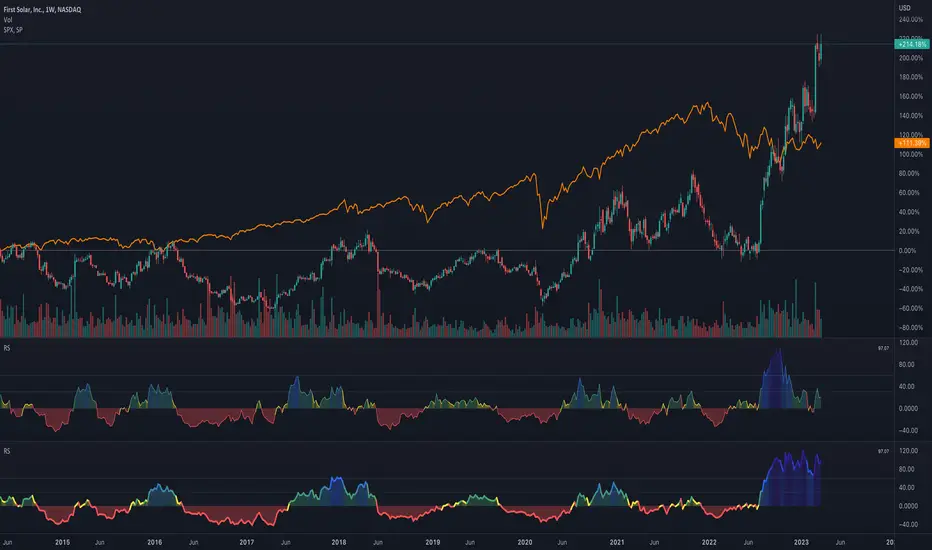
Relative strength (RS) is a measure of a stock's price performance relative to the overall market. It is calculated by dividing the stock's price change over a specified period by the market's price change over the same period. A stock with a high RS has outperformed the market, while a stock with a low RS has underperformed. (Stock can any asset that can be compared to a reference index like as Bitcoin, Altcoins etc ...)
Here are some advantages:
- Provides a measure of a stock's performance relative to a benchmark index or sector, allowing for a more accurate comparison of performance.
- Helps identify stocks with strong price momentum that are likely to continue outperforming the market in the short to medium term.
- Allows investors to identify the strongest performers within a particular sector or industry.
- Provides a quantitative and objective measure of a stock's performance, which can help reduce bias in investment decisions.
- Can be used in conjunction with other technical indicators and chart analysis to identify potentially profitable trades.
- Helps investors make more informed decisions by providing a more comprehensive picture of a stock's performance.
How to use it:
- The indicator can be used in daily and weekly timeframes.
- Check, if the default reference index is suited for your asset (Settings) The default is the combination of S&P500+Nasdaq+Dow Jones. For Crypto, it could be TOTAL (ticker for total stock market), for German stocks it could be DAX.
- Decide (settings), if you want to see the RS based on annual calculation (IBD style) or based only for the last quarter
Color coding:
- Red: Stock is performing worse than index (RS < 0)
- Yellow: Stock get momentum, starting to perform better than index (RS > 0)
- Green: Stock is outperforming the index
- Blue: Stock is a shooting star compared to index
- When RS turns positive and stays there, it could be an indication for an outbreak (maybe into a stage 2)
No financial advise. For education purposes only.
版本注释
version 2Obsolete
- deleted annual vs quarterly selection, now only annual is being used
- deleted source selection, close is now always been used
New
- Select Relative Strength based on index, i.e. selected reference ticker
- Select Relative Strength based on sector, automatically calculated using sector ETFs
- Table is showing the asset type and sector with the corresponding RS values
开源脚本
秉承TradingView的精神,该脚本的作者将其开源,以便交易者可以查看和验证其功能。向作者致敬!您可以免费使用该脚本,但请记住,重新发布代码须遵守我们的网站规则。
免责声明
这些信息和出版物并非旨在提供,也不构成TradingView提供或认可的任何形式的财务、投资、交易或其他类型的建议或推荐。请阅读使用条款了解更多信息。
免责声明
这些信息和出版物并非旨在提供,也不构成TradingView提供或认可的任何形式的财务、投资、交易或其他类型的建议或推荐。请阅读使用条款了解更多信息。