OPEN-SOURCE SCRIPT
已更新 THE Bucknut test PARI (SPY)
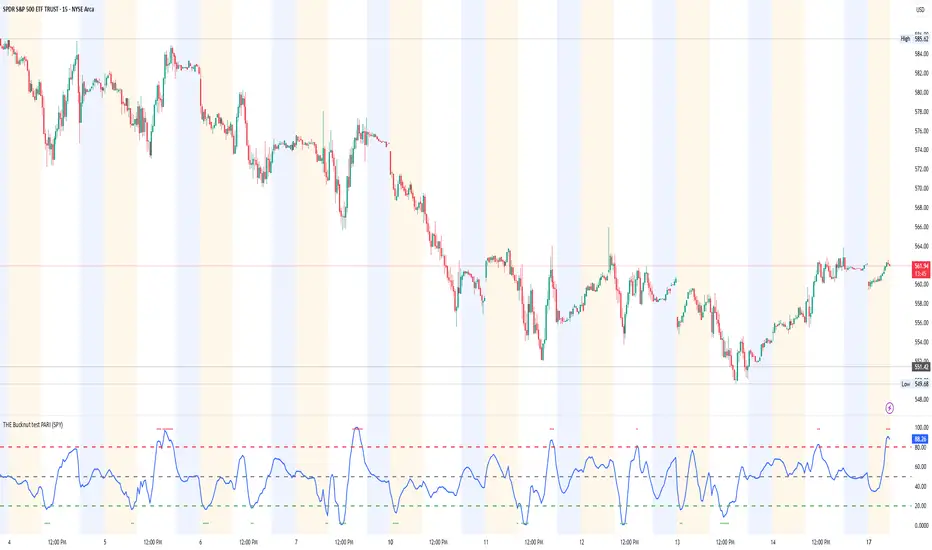
📌 THE Bucknut Test PARI – Market Momentum & Volatility Gauge
🔹 Description
THE Bucknut Test PARI Indicator is a momentum and volatility-based market gauge designed to provide clear, actionable insights on price movement. This indicator calculates a Price Action Relative Index (PARI) score to help traders evaluate risk and potential market reversals.
It utilizes exponential moving average (EMA)-based momentum, standard deviation volatility, and SPY correlation to generate a PARI score between 1-100. The score is then categorized into risk zones, helping traders identify when conditions are favorable for entries or caution is needed.
Ideal for intraday traders, options traders (including SPX 0DTE), and swing traders looking to gauge volatility-driven market shifts.
🔥 Features & Functionality
✅ Momentum Calculation via EMA Filtering – Ensures smooth, responsive signals.
✅ Volatility-Based Adjustments – Uses standard deviation-based volatility scaling.
✅ SPY Correlation Filtering – Helps align momentum signals with market sentiment.
✅ User-Defined Timeframe Settings – Adjusts dynamically based on selected time intervals.
✅ Customizable Risk Thresholds – Allows traders to define high-risk, neutral, and low-risk zones.
✅ Non-Repainting Algorithm – Ensures reliable, static signals without revision.
⚙️ Settings & Adjustments
Setting Default Value Description
Time Frame Mode "5m-15m" Choose between 1m-3m, 5m-15m, or 1H-Daily. Affects smoothing values.
Scaling Factor 10 Adjusts PARI score sensitivity. Higher values amplify movement.
Background Color Black Custom background for the indicator panel.
Background Transparency 85 Controls indicator panel opacity (0 = solid, 100 = invisible).
High-Risk Threshold 80 Above this level, market is in overbought/high-risk conditions.
Low-Risk Threshold 20 Below this level, market is oversold/low-risk for potential reversals.
Neutral Level 50 Middle ground where price action is balanced.
📈 How to Use THE Bucknut Test PARI
🔴 Above 80 (High-Risk Zone)
Market may be overheated, strong momentum may fade or reverse soon.
Caution with calls; potential put opportunities.
🟢 Below 20 (Low-Risk Zone)
Market is oversold, potential reversal or bounce incoming.
Consider long entries or avoiding shorts.
⚪ Between 20-80 (Neutral Zone)
Market is in equilibrium; follow primary trend direction.
No extreme risk, trend-following strategies preferred.
🔍 Example Use Cases
✔ Intraday Traders → Gauge market strength on short-term charts (1m-15m).
✔ SPX 0DTE Options Traders → Time high-confidence call/put setups.
✔ Swing Traders → Identify periods of excessive momentum or exhaustion.
版本注释
📌 THE Bucknut Test PARI – Market Momentum & Volatility Gauge🔹 Description
THE Bucknut Test PARI Indicator is a momentum and volatility-based market gauge designed to provide clear, actionable insights on price movement. This indicator calculates a Price Action Relative Index (PARI) score to help traders evaluate risk and potential market reversals.
It utilizes exponential moving average (EMA)-based momentum, standard deviation volatility, and SPY correlation to generate a PARI score between 1-100. The score is then categorized into risk zones, helping traders identify when conditions are favorable for entries or caution is needed.
Ideal for intraday traders, options traders (including SPX 0DTE), and swing traders looking to gauge volatility-driven market shifts.
🔥 Features & Functionality
✅ Momentum Calculation via EMA Filtering – Ensures smooth, responsive signals.
✅ Volatility-Based Adjustments – Uses standard deviation-based volatility scaling.
✅ SPY Correlation Filtering – Helps align momentum signals with market sentiment.
✅ User-Defined Timeframe Settings – Adjusts dynamically based on selected time intervals.
✅ Customizable Risk Thresholds – Allows traders to define high-risk, neutral, and low-risk zones.
✅ Non-Repainting Algorithm – Ensures reliable, static signals without revision.
⚙️ Settings & Adjustments
Setting Default Value Description
Time Frame Mode "5m-15m" Choose between 1m-3m, 5m-15m, or 1H-Daily. Affects smoothing values.
Scaling Factor 10 Adjusts PARI score sensitivity. Higher values amplify movement.
Background Color Black Custom background for the indicator panel.
Background Transparency 85 Controls indicator panel opacity (0 = solid, 100 = invisible).
High-Risk Threshold 80 Above this level, market is in overbought/high-risk conditions.
Low-Risk Threshold 20 Below this level, market is oversold/low-risk for potential reversals.
Neutral Level 50 Middle ground where price action is balanced.
📈 How to Use THE Bucknut Test PARI
🔴 Above 80 (High-Risk Zone)
Market may be overheated, strong momentum may fade or reverse soon.
Caution with calls; potential put opportunities.
🟢 Below 20 (Low-Risk Zone)
Market is oversold, potential reversal or bounce incoming.
Consider long entries or avoiding shorts.
⚪ Between 20-80 (Neutral Zone)
Market is in equilibrium; follow primary trend direction.
No extreme risk, trend-following strategies preferred.
🔍 Example Use Cases
✔ Intraday Traders → Gauge market strength on short-term charts (1m-15m).
✔ SPX 0DTE Options Traders → Time high-confidence call/put setups.
✔ Swing Traders → Identify periods of excessive momentum or exhaustion.
开源脚本
秉承TradingView的精神,该脚本的作者将其开源,以便交易者可以查看和验证其功能。向作者致敬!您可以免费使用该脚本,但请记住,重新发布代码须遵守我们的网站规则。
免责声明
这些信息和出版物并非旨在提供,也不构成TradingView提供或认可的任何形式的财务、投资、交易或其他类型的建议或推荐。请阅读使用条款了解更多信息。
开源脚本
秉承TradingView的精神,该脚本的作者将其开源,以便交易者可以查看和验证其功能。向作者致敬!您可以免费使用该脚本,但请记住,重新发布代码须遵守我们的网站规则。
免责声明
这些信息和出版物并非旨在提供,也不构成TradingView提供或认可的任何形式的财务、投资、交易或其他类型的建议或推荐。请阅读使用条款了解更多信息。