Trendlines_Pro[vn]
-Pine Script strategy draws pivot points and trendlines on the chart.
-This strategy allows the user to specify the interval to calculate the pivot points and the number of pivot points used to generate the trend lines.
-when an up (or down) trendline is drawn according to the settings in the indicator's settings, that line is support and resistance so we can proceed to make BUY or SELL points according to the support strategy. and resistance
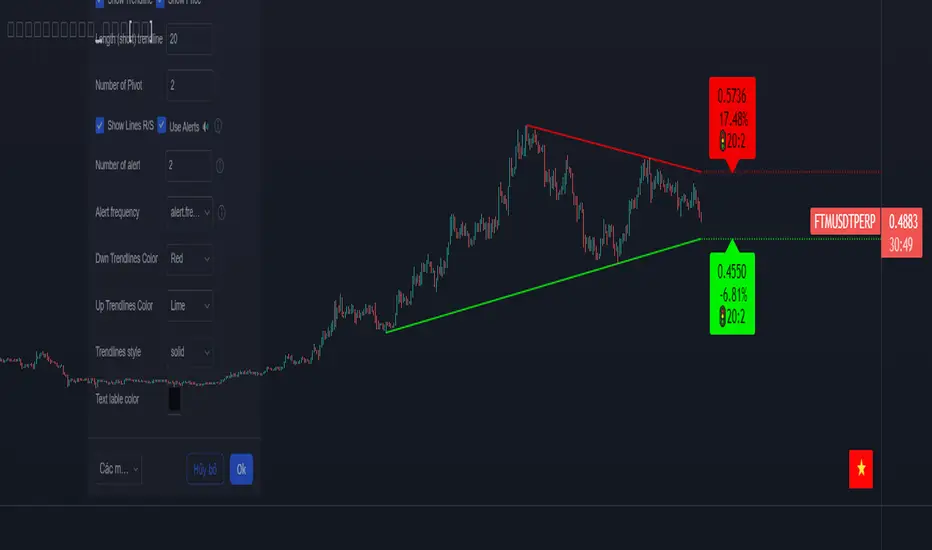
-when the price line breaks above or below the trendline, the price has reversed to the nearest trendline (like the examples in the pictures below.)
-The horizontal lines of the trend line, after being broken, it will form a support or resistance area, and it is likely that the price will retest that area to continue following the broken trend.
Vietnamese
-Đây là chỉ báo dành cho các trader thuộc trường phái phân tích đường xu hướng
-Chiến lược Pine Script vẽ các điểm trục và đường xu hướng trên biểu đồ.
-Chiến lược này cho phép người dùng chỉ định khoảng thời gian tính toán các điểm xoay và số điểm xoay được sử dụng để tạo các đường xu hướng .
-khi đường xu hướng tăng(hoặc giảm) được vẽ ra theo các thiết lập trong cài đặt của chỉ báo,thì đường đó là hỗ trợ,kháng cự để ta có thể tiến hành thực hiện điểm BUY hoặc SELL theo chiến lược hỗ trợ và kháng cự
-khi đường giá mà phá vỡ lên trên hoặc xuống dưới đường xu hướng thì giá đã đảo chiều ngược với đường xu hướng gần nhất (như các ví dụ trong các hình dưới đây.)
-Những đường nằm ngang của đường xu hướng sau khi bị phá vỡ nó sẽ hình thành cho ta là vùng hỗ trợ hoặc kháng cự mà rất có thể giá sẽ kiểm tra lại vùng đó để tiếp tục theo xu hướng bị phá vỡ.
- Change the color of the trendline as you like(đổi màu đường trendline tùy ý theo sở thích)
- Change the way the trendline is drawn(thay đổi cách vẽ đường trendline)
- Clearly show the distance between the current price and the existing trendlines(hiện rõ khoảng cách giữa giá hiện tại với các đường trendline đang có)
- Warning option and number of warnings(tùy chọn cảnh báo và số lần cảnh báo)
- Clearly show the value of support and resistance lines after the trendline is broken(hiện rõ ràng giá trị của đường kháng cự,hỗ trợ sau khi trendline bị phá qua)
Small timeframes such as m1, m3, m5 or D1 I leave the default (cannot be changed) in the 'Length' setting = 50, timeframe is H6, H8, H12 'Length' = 30, the rest of the time can be changed, the default is 20 ...
仅限邀请脚本
Only users approved by the author can access this script. You'll need to request and get permission to use it. This is typically granted after payment. For more details, follow the author's instructions below or contact ichimoku14642 directly.
TradingView does NOT recommend paying for or using a script unless you fully trust its author and understand how it works. You may also find free, open-source alternatives in our community scripts.
作者的说明
免责声明
仅限邀请脚本
Only users approved by the author can access this script. You'll need to request and get permission to use it. This is typically granted after payment. For more details, follow the author's instructions below or contact ichimoku14642 directly.
TradingView does NOT recommend paying for or using a script unless you fully trust its author and understand how it works. You may also find free, open-source alternatives in our community scripts.