OPEN-SOURCE SCRIPT
已更新 Dynamic Candle Strength
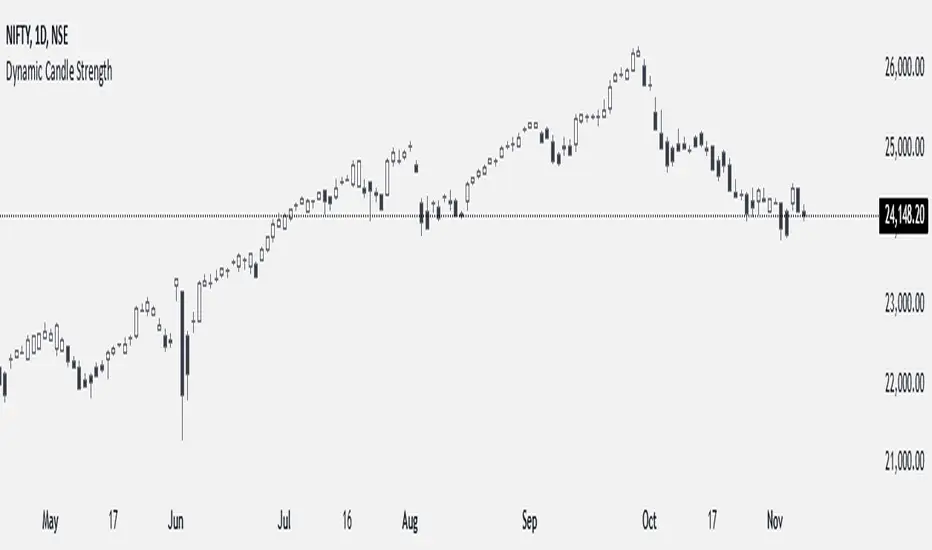
How It Works
Initialization of Dynamic Levels:
The first candle's high and low are taken as the initial dynamic high and dynamic low levels.
If the next candle's close price is above the dynamic high, the candle is colored green, indicating bullish conditions.
If the next candle's close price is below the dynamic low, the candle is colored black, indicating bearish conditions.
If a candle's high and low crossed both the dynamic high and dynamic low, the dynamic high and low levels are updated to the high and low of that candle, but the candle color will continue with the same color as the previous candle.
Maintaining and Updating Dynamic Levels:
The dynamic high and low are only updated if a candle's close is above the current dynamic high or below the current dynamic low.
If the candle does not close above or below these levels, the dynamic high and low remain unchanged.
Visual Signals:
Green Bars: Indicate that the candle's close is above the dynamic high, suggesting bullish conditions.
Black Bars: Indicate that the candle's close is below the dynamic low, suggesting bearish conditions.
This method ensures that the dynamic high and low levels are adjusted in real-time based on the most recent significant price movements, providing a reliable measure of market sentiment.
版本注释
Dynamic Variables: The script defines dynamicHigh, dynamicLow, dynamicOpen, and dynamicClose to track the high, low, open, and close values of candles.Update Dynamic Values: Dynamic values are updated based on the close price. If dynamicHigh or dynamicLow is na, or if the current close breaches either threshold, the values are set to the current candle's high, low, open, and close.
Determine Bullish and Bearish Conditions: The script checks if dynamicClose is less than dynamicOpen to identify bearish conditions or if dynamicClose is greater than dynamicOpen for bullish conditions.
Bar Color: Bars are colored green when dynamicClose is greater than dynamicOpen, indicating a bullish condition, and red when it is less, indicating a bearish condition.
版本注释
The previous version was not able to handle gap-up or gap-down situations, so those conditions have been added.版本注释
The previous version was not able to handle gap-up or gap-down situations, so those conditions have been added.开源脚本
秉承TradingView的精神,该脚本的作者将其开源,以便交易者可以查看和验证其功能。向作者致敬!您可以免费使用该脚本,但请记住,重新发布代码须遵守我们的网站规则。
Sreenureddy
免责声明
这些信息和出版物并非旨在提供,也不构成TradingView提供或认可的任何形式的财务、投资、交易或其他类型的建议或推荐。请阅读使用条款了解更多信息。
开源脚本
秉承TradingView的精神,该脚本的作者将其开源,以便交易者可以查看和验证其功能。向作者致敬!您可以免费使用该脚本,但请记住,重新发布代码须遵守我们的网站规则。
Sreenureddy
免责声明
这些信息和出版物并非旨在提供,也不构成TradingView提供或认可的任何形式的财务、投资、交易或其他类型的建议或推荐。请阅读使用条款了解更多信息。