PROTECTED SOURCE SCRIPT
已更新 Multiple Timeframe Levels

Based on Rob Smith from T3Live's "The Strat" system.
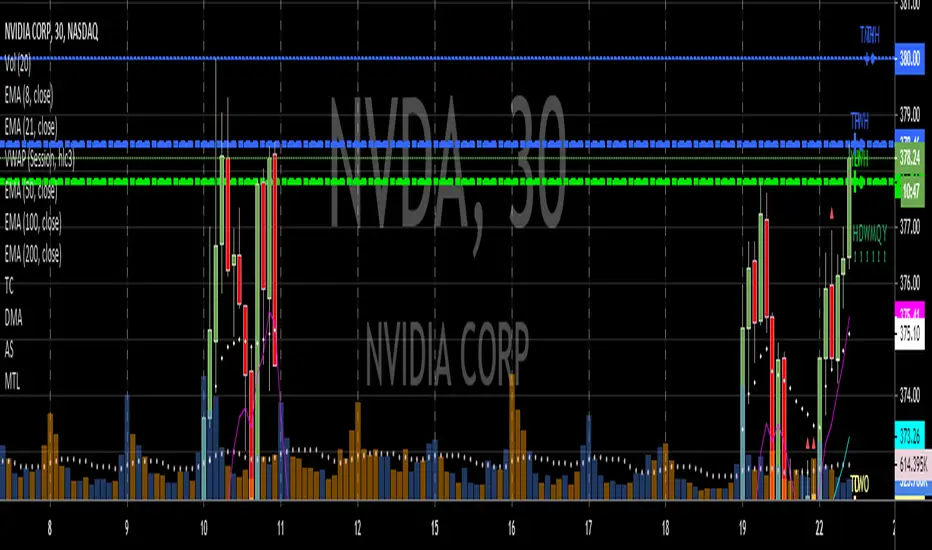
Draws lines and labels for high/low of prior day, current day, prior week, current week, prior month, current month, prior year and current year.
Draws lines and labels for current day, week, month and year open.
Not recommended for those who have not completed Rob's course.
Draws lines and labels for high/low of prior day, current day, prior week, current week, prior month, current month, prior year and current year.
Draws lines and labels for current day, week, month and year open.
Not recommended for those who have not completed Rob's course.
版本注释
Cleaned up label names. Minor change.版本注释
Moved all break of prior time frame level alerts from "Actionable Signals" script to this one.版本注释
Alerts now include ticker and price at time alert was triggered.Example: "Prior Day Break (QQQ 196.50) "
The space at the end of the text is included so that you can more quickly add custom details.
版本注释
Corrected coding translation errors between V3 and V4.版本注释
Fixed a minor typo版本注释
Reversed the thickness of horizontal lines: Daily interval is thickest, monthly interval is thinnest.受保护脚本
此脚本以闭源形式发布。 但是,您可以自由使用,没有任何限制 — 了解更多信息这里。
免责声明
这些信息和出版物并非旨在提供,也不构成TradingView提供或认可的任何形式的财务、投资、交易或其他类型的建议或推荐。请阅读使用条款了解更多信息。
受保护脚本
此脚本以闭源形式发布。 但是,您可以自由使用,没有任何限制 — 了解更多信息这里。
免责声明
这些信息和出版物并非旨在提供,也不构成TradingView提供或认可的任何形式的财务、投资、交易或其他类型的建议或推荐。请阅读使用条款了解更多信息。