OPEN-SOURCE SCRIPT
J Weighted Average Price
📘 How to Use the OBV VWAP Reentry Signal Effectively
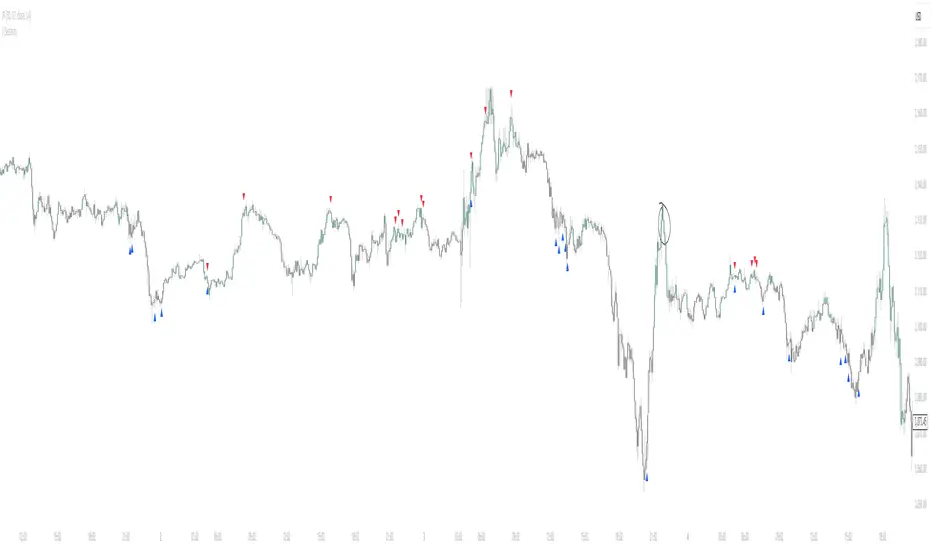
This indicator plots a VWAP based on OBV (On-Balance Volume), along with dynamic bands to identify overbought and oversold conditions in volume flow.
🔺 Red Triangle Up: Appears when OBV crosses back below the upper band → Potential reversal from overbought → Watch for short opportunities.
🔻 Blue Triangle Down: Appears when OBV crosses back above the lower band → Potential reversal from oversold → Watch for long opportunities.
📌 Tip: Use these signals in confluence with price action or trend confirmation to filter false signals. For example:
Enter short after a reentry from upper band and a lower high in price.
Enter long after a reentry from lower band and a bullish candle structure.
This setup helps you catch mean reversion moves based on volume flow, not just price.
开源脚本
秉承TradingView的精神,该脚本的作者将其开源,以便交易者可以查看和验证其功能。向作者致敬!您可以免费使用该脚本,但请记住,重新发布代码须遵守我们的网站规则。
免责声明
这些信息和出版物并非旨在提供,也不构成TradingView提供或认可的任何形式的财务、投资、交易或其他类型的建议或推荐。请阅读使用条款了解更多信息。
开源脚本
秉承TradingView的精神,该脚本的作者将其开源,以便交易者可以查看和验证其功能。向作者致敬!您可以免费使用该脚本,但请记住,重新发布代码须遵守我们的网站规则。
免责声明
这些信息和出版物并非旨在提供,也不构成TradingView提供或认可的任何形式的财务、投资、交易或其他类型的建议或推荐。请阅读使用条款了解更多信息。