OPEN-SOURCE SCRIPT
已更新 Pere's Weekly Analysis V3
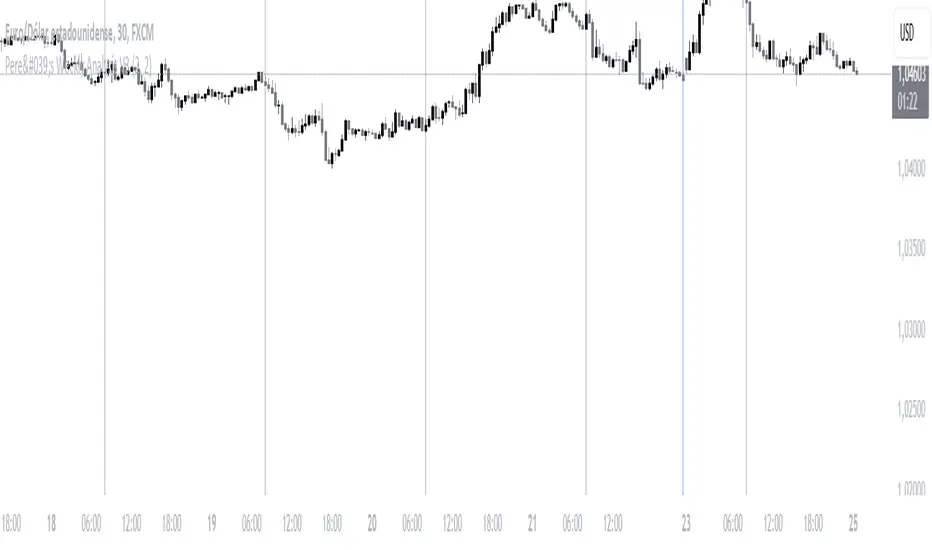
This indicator is very simple; it is basically composed of a series of thin vertical lines and thicker ones:
- The thin lines symbolize the opening of the London session, which marks the beginning of a new day in the forex market.
- The thick lines, due to their prominence, represent the end of a week with the closing of the Asian session.
The combination of these two lines allows for a deeper understanding of what happens each day, enabling market analysis in lower timeframes, such as a 5-minute or 10-minute chart, without losing sight of the daily opening and closing references.
This indicator can be used to identify previous days' highs and lows, mark them as potential liquidity zones, and look for price reactions to these areas during the current day. Traders can combine this indicator with their personal strategies, simplifying chart analysis.
It is essential to have a solid understanding of market behavior and always trade with optimal risk management.
ESPAÑOL:
Este indicador es muy sencillo, básicamente está compuesto por una serie de líneas verticales delgadas y otras más gruesas:
- Las delgadas simbolizan la apertura de la sesión de Londres, es decir el inicio de un día nuevo en el mercado del forex.
- Las gruesas por su saldo simbolizan el final de una semana con el cierre de la sesión asiática.
Las combinación de estas 2 líneas nos permite tener una comprensión más profunda de lo que ocurre en cada día, pudiendo analizar el mercado en temporalidades más bajas, como por ejemplo, una temporalidad de 5 minutos o de 10 minutos, Pero sin perder las referencias del inicio y final de cada día.
Este indicador se puede utilizar para identificar máximos y mínimos de los días anteriores, marcarlos como potenciales zonas de liquidez, y buscar reacciones a dichas zonas durante el día actual. Los trader puede combinar este indicar con sus estrategias personales simplificando la lectura de los gráficos.
Es importante tener una buena comprensión del comportamiento de los mercado y siempre operar con una óptima gestión del riesgo.
版本注释
This indicator is very simple; it is basically composed of a series of thin vertical lines and thicker ones:- The thin lines symbolize the opening of the London session, which marks the beginning of a new day in the forex market.
- The thick lines, due to their prominence, represent the end of a week with the closing of the Asian session.
The combination of these two lines allows for a deeper understanding of what happens each day, enabling market analysis in lower timeframes, such as a 5-minute or 10-minute chart, without losing sight of the daily opening and closing references.
This indicator can be used to identify previous days' highs and lows, mark them as potential liquidity zones, and look for price reactions to these areas during the current day. Traders can combine this indicator with their personal strategies, simplifying chart analysis.
It is essential to have a solid understanding of market behavior and always trade with optimal risk management.
开源脚本
秉承TradingView的精神,该脚本的作者将其开源,以便交易者可以查看和验证其功能。向作者致敬!您可以免费使用该脚本,但请记住,重新发布代码须遵守我们的网站规则。
免责声明
这些信息和出版物并非旨在提供,也不构成TradingView提供或认可的任何形式的财务、投资、交易或其他类型的建议或推荐。请阅读使用条款了解更多信息。
开源脚本
秉承TradingView的精神,该脚本的作者将其开源,以便交易者可以查看和验证其功能。向作者致敬!您可以免费使用该脚本,但请记住,重新发布代码须遵守我们的网站规则。
免责声明
这些信息和出版物并非旨在提供,也不构成TradingView提供或认可的任何形式的财务、投资、交易或其他类型的建议或推荐。请阅读使用条款了解更多信息。