PROTECTED SOURCE SCRIPT
已更新 RSI(EMA) - Reducing Noise
This script is a modified version of the Relative Strength Indicator ( RSI ). While using RSI to trade the markets, the signals generated are very choppy.
Approach 1. One way to reduce this noise is to use a higher period for the RSI calculation. (say 20 instead of 14 period). In this approach, the valid signal comes quite late.
Approach 2. My unique solution is to use a Exponential Moving Average as the input for the RSI calculation. Usually RSI calculations are based on close value of the candles. If we use an appropriate EMA value, then the signal efficiency will increase.
Using the approach 2, strategies similar to regular RSI can be utilized i.e. RSI breakout, RSI divergence, RSI Hidden divergence.
RSI Colors explained
Breakout Strategy
Recommended default settings: EMA =7 period , RSI =14 period
ADDITIONAL TIP: Works wonderfully with Pivot Points (standard)
I recommended to use on minimum 5 MINUTE timeframe for intraday trades. But you can use different timeframes as well.
Please leave comment below If you have any question or development idea.
Approach 1. One way to reduce this noise is to use a higher period for the RSI calculation. (say 20 instead of 14 period). In this approach, the valid signal comes quite late.
Approach 2. My unique solution is to use a Exponential Moving Average as the input for the RSI calculation. Usually RSI calculations are based on close value of the candles. If we use an appropriate EMA value, then the signal efficiency will increase.
Using the approach 2, strategies similar to regular RSI can be utilized i.e. RSI breakout, RSI divergence, RSI Hidden divergence.
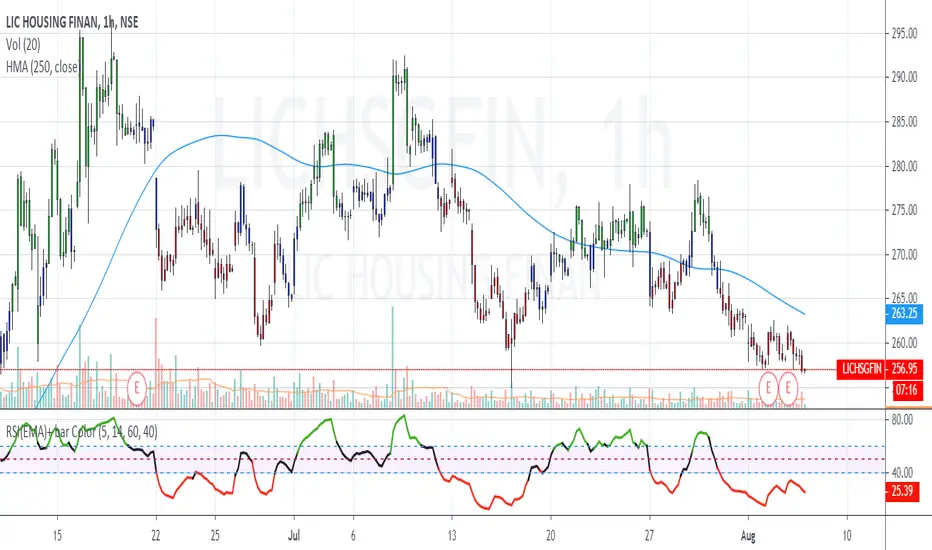
RSI Colors explained
- GREEN = BULLISH momentum when RSI >60
- RED = BEARISH momentum when RSI <40
- BLACK = NEUTRAL market conditions when RSI is between 40 and 60
Breakout Strategy
- LONGS - RSI color is GREEN + Price breaks a Resistance
- SHORTS - RSI color is RED + Price breaks a Support
Recommended default settings: EMA =7 period , RSI =14 period
ADDITIONAL TIP: Works wonderfully with Pivot Points (standard)
I recommended to use on minimum 5 MINUTE timeframe for intraday trades. But you can use different timeframes as well.
Please leave comment below If you have any question or development idea.
版本注释
NEW UPDATE: Version 2.01. Candle color changes made. Borrowed the idea from RolandoSantos from his TKP RSI BAR COLOR indicator. The code was simplified to adjust to the RSI conditions.
2. RSI Upper and lower band values can be adjusted using ---> Bullish Bar Color and Bearish Bar Color inputs
3. Interpreting
Candle Color BLUE ----> side ways market (RSI value is between upper band and lower band values)
Candle Color GREEN ----> bullish market (RSI value is above upper band)
Candle Color RED ----> Bearish market (RSI value below lower band)
TIP: Use Hull Moving Average (200 period) to filter trades.
I hope you like this new update.
受保护脚本
此脚本以闭源形式发布。 但是,您可以自由使用,没有任何限制 — 了解更多信息这里。
免责声明
这些信息和出版物并非旨在提供,也不构成TradingView提供或认可的任何形式的财务、投资、交易或其他类型的建议或推荐。请阅读使用条款了解更多信息。
免责声明
这些信息和出版物并非旨在提供,也不构成TradingView提供或认可的任何形式的财务、投资、交易或其他类型的建议或推荐。请阅读使用条款了解更多信息。