OPEN-SOURCE SCRIPT
SMA200 & RSI [Tarun]
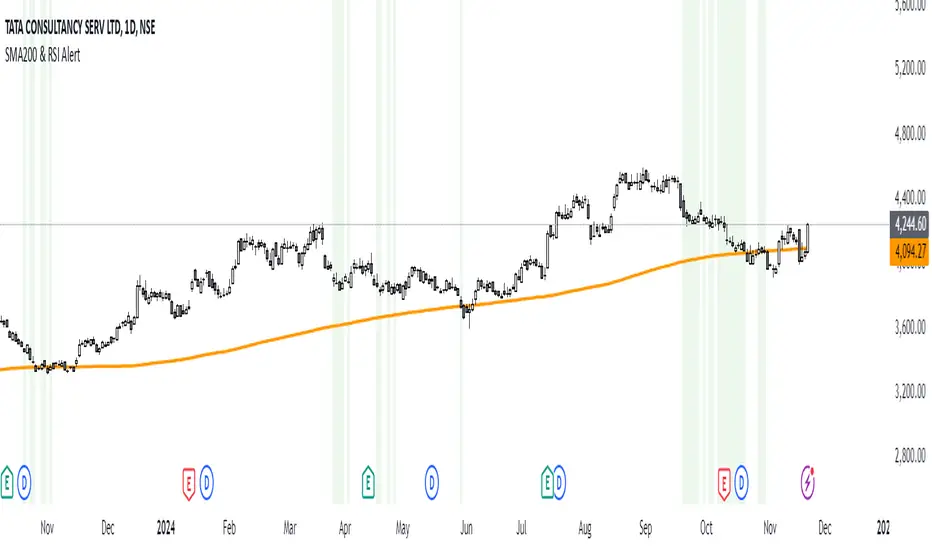
The SMA200 & RSI Signal Indicator is a powerful tool designed for traders who want to identify potential entry zones based on a combination of price action and momentum. This indicator combines two essential trading components:
How It Works:
When both conditions are met, the indicator triggers:
Disclaimer:
- SMA200 (Simple Moving Average): A widely used trend-following tool that highlights the overall direction of the market.
- RSI (Relative Strength Index): A momentum oscillator that measures the speed and change of price movements.
How It Works:
- Price Above SMA200: Indicates bullish market conditions.
- RSI Between 40 and 20: Suggests that the asset is in a potential oversold or pullback zone within a bullish trend.
When both conditions are met, the indicator triggers:
- Background Highlight: The chart background turns green to indicate a potential signal zone.
Disclaimer:
This indicator is not a standalone trading strategy. Use it in conjunction with other analysis methods such as support and resistance, candlestick patterns, or volume analysis. Always practice proper risk management.
开源脚本
秉承TradingView的精神,该脚本的作者将其开源,以便交易者可以查看和验证其功能。向作者致敬!您可以免费使用该脚本,但请记住,重新发布代码须遵守我们的网站规则。
免责声明
这些信息和出版物并非旨在提供,也不构成TradingView提供或认可的任何形式的财务、投资、交易或其他类型的建议或推荐。请阅读使用条款了解更多信息。
开源脚本
秉承TradingView的精神,该脚本的作者将其开源,以便交易者可以查看和验证其功能。向作者致敬!您可以免费使用该脚本,但请记住,重新发布代码须遵守我们的网站规则。
免责声明
这些信息和出版物并非旨在提供,也不构成TradingView提供或认可的任何形式的财务、投资、交易或其他类型的建议或推荐。请阅读使用条款了解更多信息。