OPEN-SOURCE SCRIPT
已更新 Relative Volume Standard Deviation
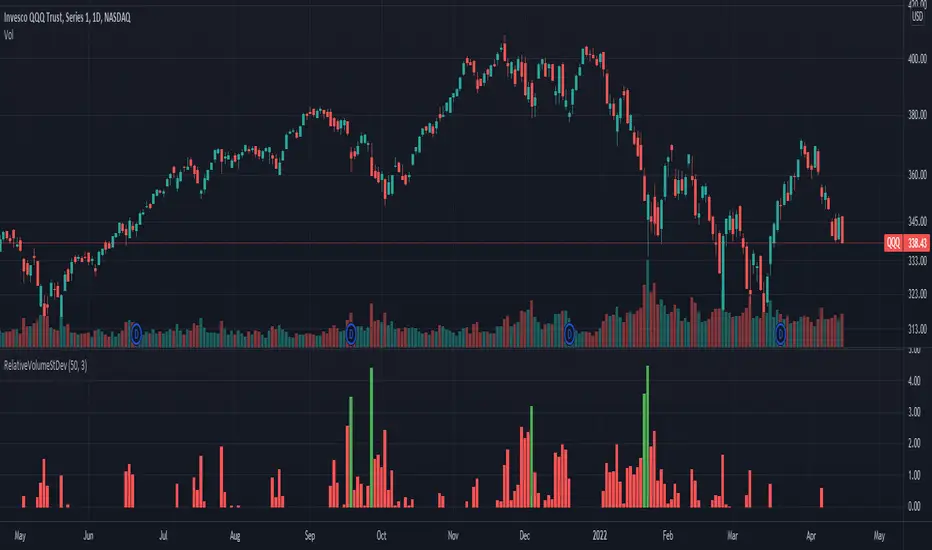
This indicator, developed by Melvin E. Dickover, calculates the difference between the volume and its simple moving average, but expressed as a ratio in standard deviations.
The plotted bars become green when the volume is unusually large (configurable).
The plotted bars become green when the volume is unusually large (configurable).
版本注释
linewidth does not make sense for column plot开源脚本
秉承TradingView的精神,该脚本的作者将其开源,以便交易者可以查看和验证其功能。向作者致敬!您可以免费使用该脚本,但请记住,重新发布代码须遵守我们的网站规则。
免责声明
这些信息和出版物并非旨在提供,也不构成TradingView提供或认可的任何形式的财务、投资、交易或其他类型的建议或推荐。请阅读使用条款了解更多信息。
免责声明
这些信息和出版物并非旨在提供,也不构成TradingView提供或认可的任何形式的财务、投资、交易或其他类型的建议或推荐。请阅读使用条款了解更多信息。